Introduction
Every VMware environment creates logs that record system activity. These logs are your best tool when you need to troubleshoot issues or check system health. But how do you analyze them efficiently? In this guide, we'll explore what VMware logs are, why they matter, and several ways to perform vmware log analysis, from basic manual checks to advanced automated solutions.
What Are VMware Logs?
VMware logs track everything happening inside your virtual infrastructure. Each component, ESXi hosts, vCenter Server, and virtual machines, generates its own set of logs. For example:
ESXi hosts keep kernel events in /var/log/vmkernel.log, host management actions in /var/log/hostd.log, storage/network issues in /var/log/vobd.log, authentication attempts in /var/log/auth.log, and hardware monitoring data in /var/log/hpHelper.log (if present).
Virtual machines store their activity in files named vmware.log within their datastore folders.
vCenter Server maintains its own records like /var/log/vmware/vpxd/vpxd.log for cluster management events.
These files can grow quickly depending on system activity levels.
Why Analyze VMware Logs?
Analyzing these logs is essential for keeping your environment healthy. When a VM fails to start or performance drops unexpectedly, the answer often lies hidden in a log file entry. Regular vmware log analysis helps you:
Pinpoint root causes of crashes or slowdowns
Detect unauthorized access attempts
Monitor configuration changes
Meet audit requirements
Ignoring log review can let small problems grow into outages or security incidents. Would you ignore warning lights on your car's dashboard? Neither should you skip regular log checks on your servers.
Best Practices for VMware Log Retention and Rotation
Managing log files is about balance, keeping enough history without filling up storage space. By default, ESXi rotates its logs using built-in settings so older entries get archived automatically as new ones arrive.
For example:
Most ESXi logs rotate daily or when they reach a certain size (usually 100MB).
The system keeps several archived versions (like vmkernel.log, vmkernel.1.gz, etc.).
You can adjust retention policies by editing /etc/vmsyslog.conf on each host if needed.
It's smart to regularly export important logs before rotation overwrites them, especially during incident investigations or audits. Consider centralizing your logs using syslog servers so nothing gets lost if local disks fail or fill up unexpectedly.
Method 1: Manual VMware Log Analysis
Manual analysis gives you direct control over raw data, a good choice for quick checks or deep dives into specific problems.
To view ESXi host logs:
1. Open the VMware Host Client via web browser
2. Click Host
3. Select Monitor
4. Go to the Logs tab
Here you'll see all available log types listed by name; click any one to read recent entries right from your browser window. Use the search field above the list to filter results by keyword, for example, type "error" to find critical issues fast.
Prefer command-line access? First enable ESXi Shell from DCUI:
1. Press F2 at console login screen
2. Choose Troubleshooting Options
3. Select Enable ESXi Shell
Then press Alt+F1 to open shell prompt locally, or connect remotely via SSH if enabled under Troubleshooting Options as well.
Common commands include:
cat /var/log/vmkernel.log | grep 'Disk I/O error'
tail -f /var/log/hostd.log
less /var/log/auth.log
Use grep with keywords like "fail", "timeout", or specific device names as needed.
To collect full diagnostic data for support cases:
1. In Host Client go back to Monitor > Logs
2. Click on Generate support bundle
3. Download archive file when prompted
Manual review works best for targeted troubleshooting but can be time-consuming across many hosts at once.
Method 2: VMware Log Analysis using vRealize Log Insight
Automated tools like vRealize Log Insight simplify large-scale vmware log analysis by collecting all records into one searchable interface with visual dashboards.
After deploying vRealize Log Insight:
1. Integrate it with your vSphere environment following official setup guides (VMware Docs)
2. Access its web UI from any browser
3. Navigate via main menu: select an object such as a host or VM then click its dedicated Logs tab (integration required)
The top of this screen features a search bar where you enter keywords ("datastore", "network error") plus filters like time range or severity level (info/warning/error). Below that is an event timeline chart showing spikes over time, which helps spot patterns linked to outages or attacks at-a-glance.
You can drill down further by clicking any event spike; expand individual entries for full details including timestamp, source IP address, user account involved, etc., all without leaving your dashboard view!
Advanced users create custom dashboards tracking frequent alerts (e.g., failed migrations), set up email notifications based on saved searches (“Send alert if 'PSOD' appears”), and share findings with team members instantly through built-in collaboration features.
Method 3: VMware Log Analysis using Splunk
Splunk provides powerful centralized logging across mixed IT landscapes, including all major VMware components, in real-time at enterprise scale.
To get started:
1. Install Splunk Universal Forwarder on each ESXi host (or configure remote syslog forwarding)
2. Deploy Splunk Add-on for VMware ESXi Logs so it recognizes native formats
3. For vCenter Server logging install Splunk Add-on for vCenter Log directly onto that server's OS
4. Assign unique syslog ports per source type so incoming streams don't conflict
Once configured correctly all incoming events appear indexed within Splunk's web UI almost instantly—even across hundreds of hosts worldwide! Use its search bar atop every page; try queries like:
source="/var/log/auth.log" failed
source="/var/log/vmkernel.log" warning
Visualizations show trends such as login failures per hour; dashboards correlate multiple sources together revealing root causes faster than piecing together separate files manually ever could!
Set up automated alerts right from any search result using Save As Alert, define thresholds (“more than five disk errors per minute”) then choose notification options like email/SMS/webhook integration so teams respond immediately day-or-night.
Interpreting Common VMware Log Entries
Understanding what typical messages mean speeds up troubleshooting dramatically during vmware log analysis sessions:
For example:
A line reading NMP: nmp_DeviceAttemptFailover... signals multipath failover was triggered due to storage path loss, check SAN connectivity next!
Seeing vMotion migration [ID] failed means live migration hit an error, look nearby in both source/destination host logs around same timestamp.
If User root logged in via SSH appears repeatedly outside normal admin hours, it may indicate unauthorized access attempts worth investigating further!
Messages containing APD detected refer to All Paths Down conditions affecting datastores, potentially leading VMs into inaccessible states until resolved.
Any mention of Purple Screen of Death (“PSOD”) means kernel panic occurred, immediate attention required since affected host will have crashed completely!
By learning these patterns, and cross-referencing timestamps between related systems, you'll solve most incidents much faster.
How to Back Up VMware Virtual Machines with Vinchin?
After addressing operational insights through thorough vmware log analysis, safeguarding workloads becomes crucial for business continuity and compliance needs alike.
Vinchin Backup & Recovery stands out as a professional enterprise-level solution supporting backup and recovery across more than 15 mainstream virtualization platforms, including robust support for VMware environments alongside Hyper-V, Proxmox, oVirt, OLVM, RHV, XCP-ng, XenServer, OpenStack, ZStack and others.
Key features available for protecting VMware VMs include quiesced snapshot creation ensuring application-consistent backups, HotAdd technology enabling efficient data transfer without production impact, CBT-based incremental backup minimizing backup windows, LAN-free backup accelerating transfers within high-speed networks, and instant recovery reducing downtime after failure, all designed to maximize efficiency while minimizing risk.
With Vinchin Backup & Recovery's intuitive web console interface backing up a VMware VM involves just four steps:
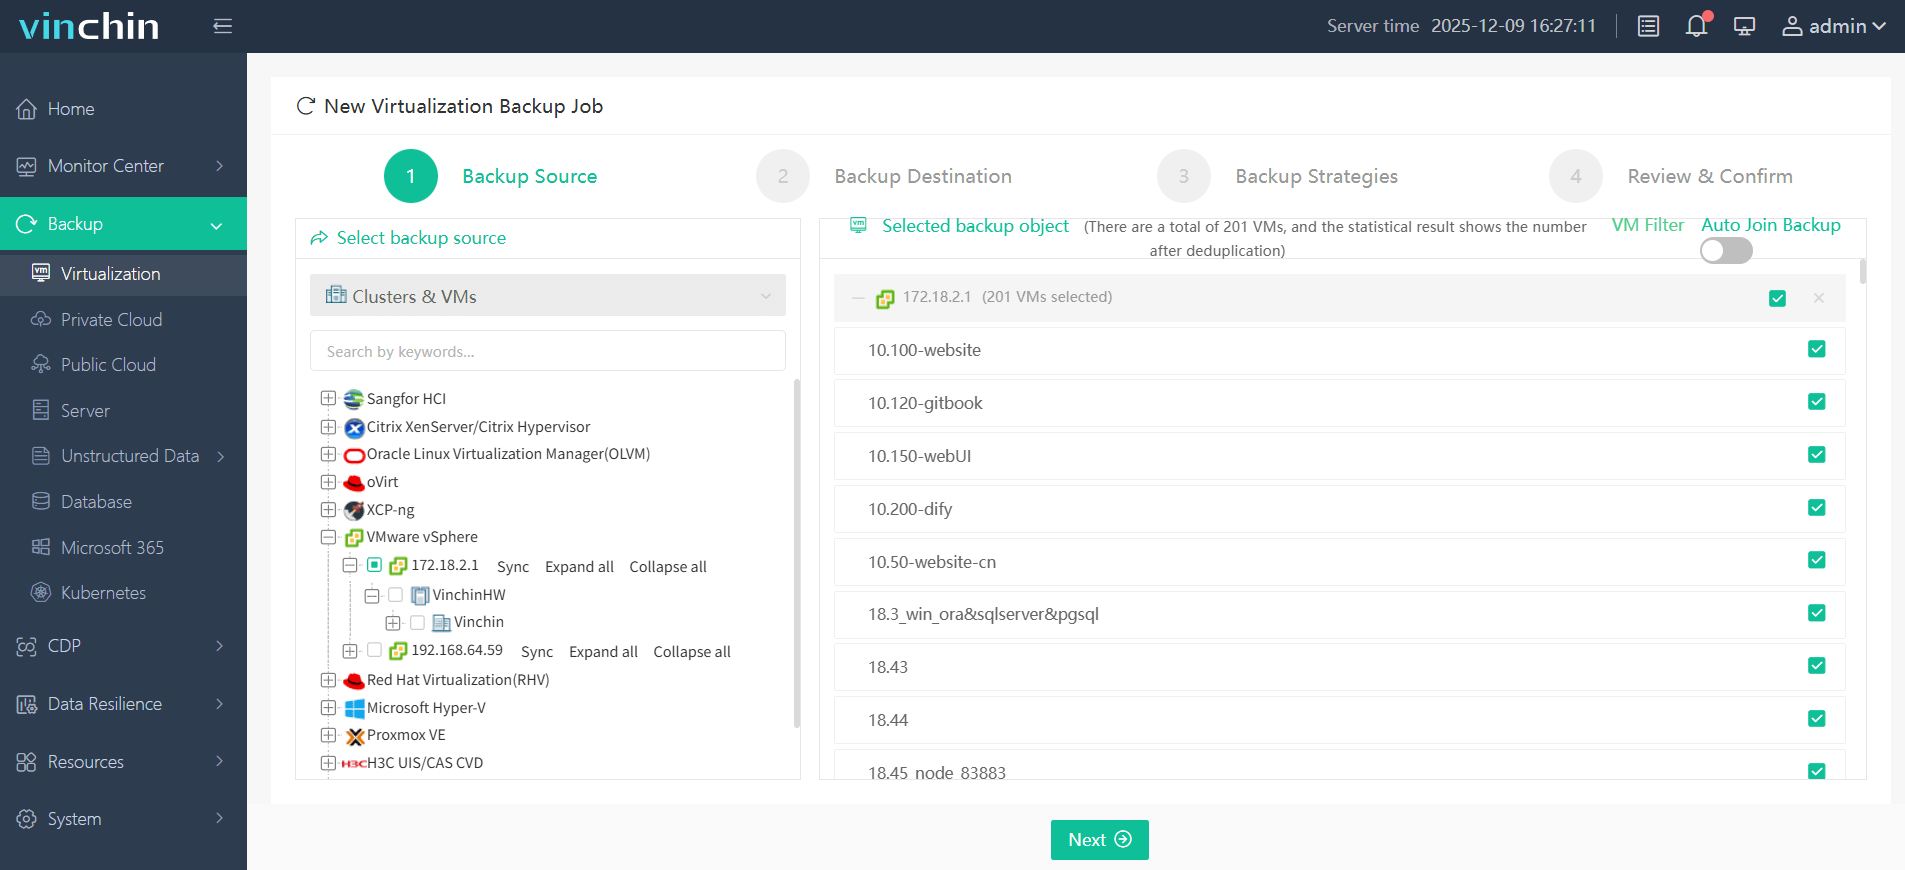
Step 1: Select the VMware VM you want to back up
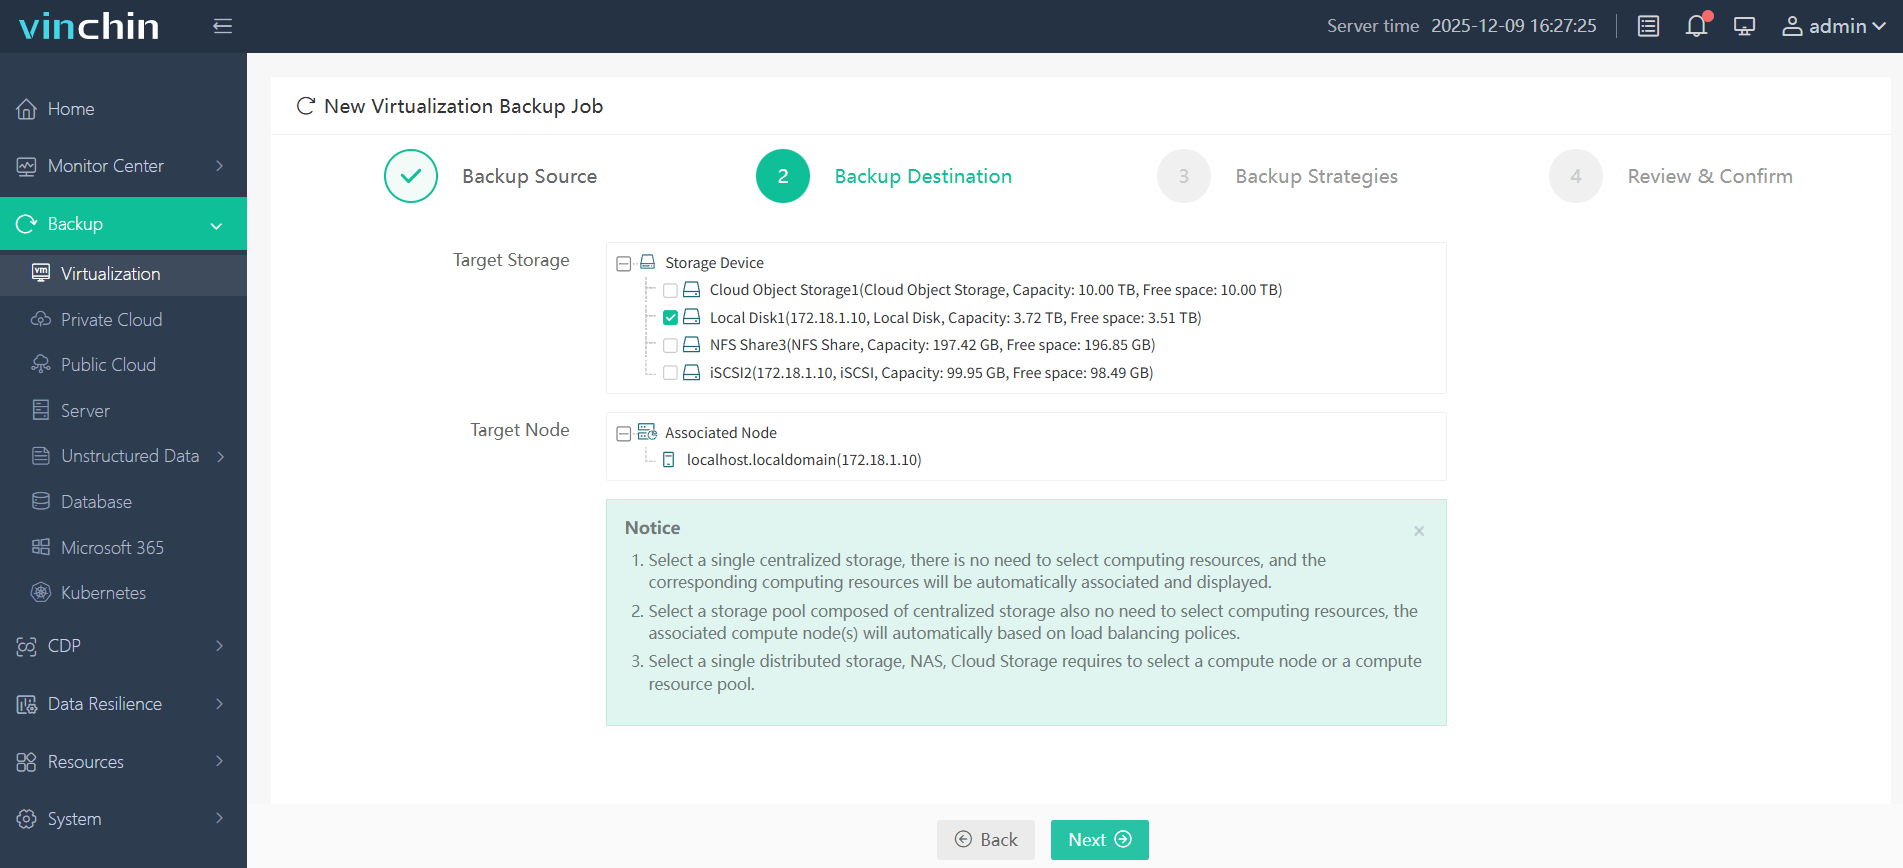
Step 2: Choose the backup storage
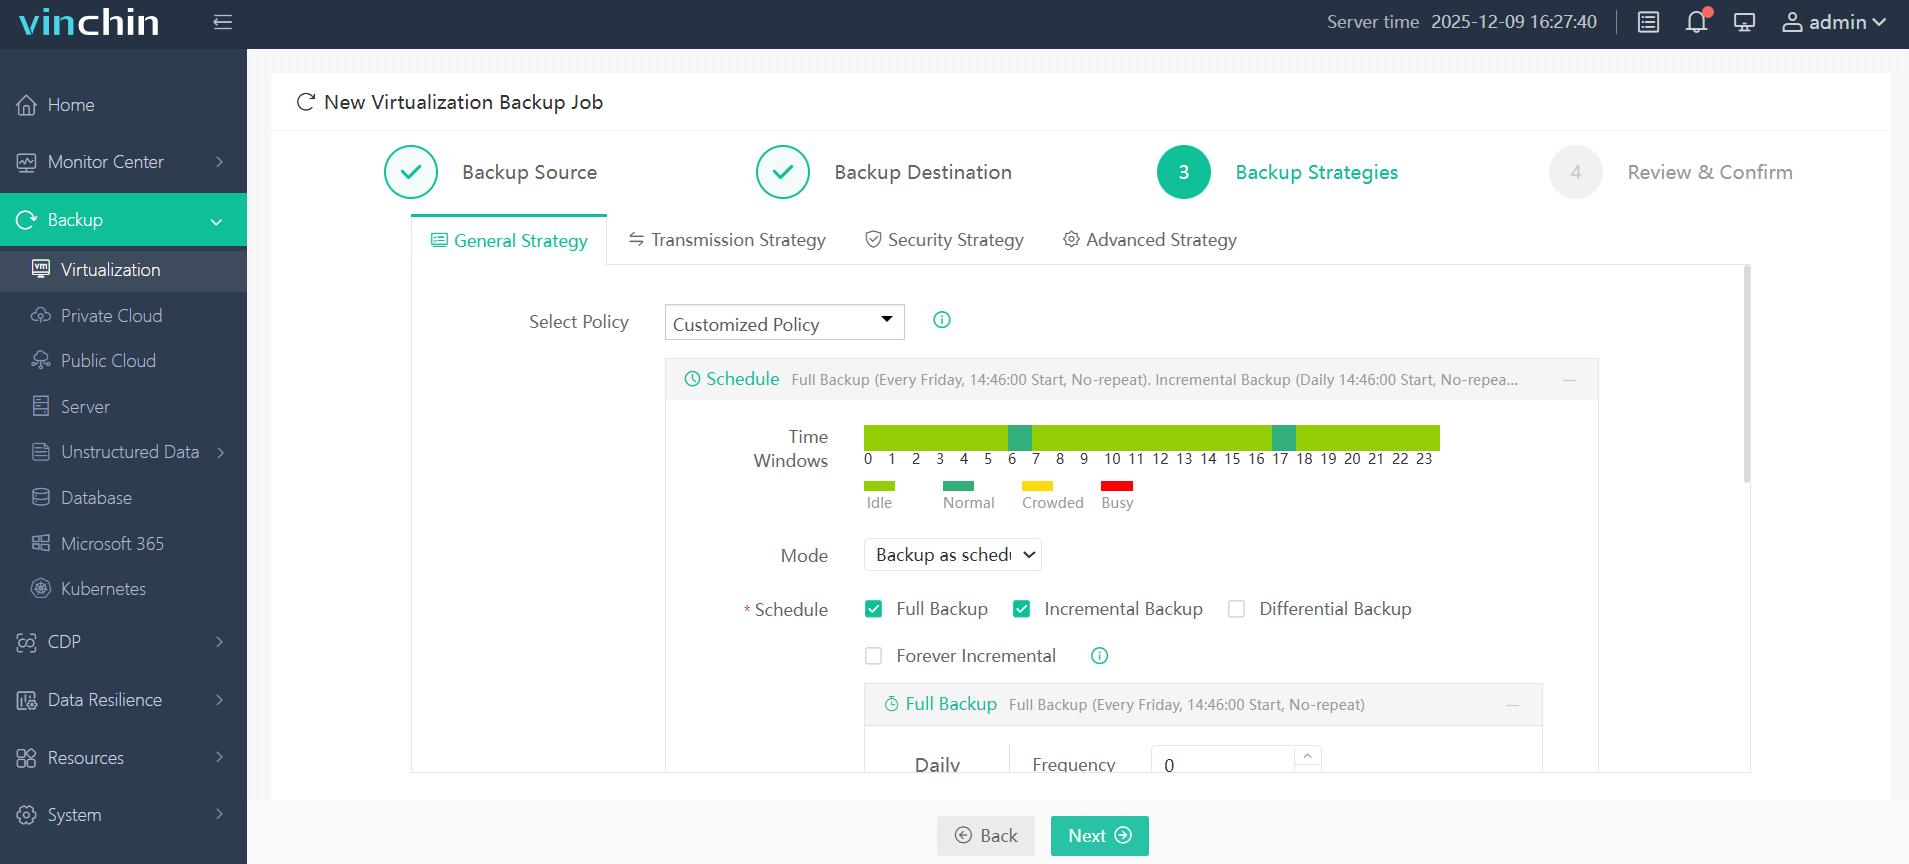
Step 3: Configure the backup strategy
Step 4: Submit the job
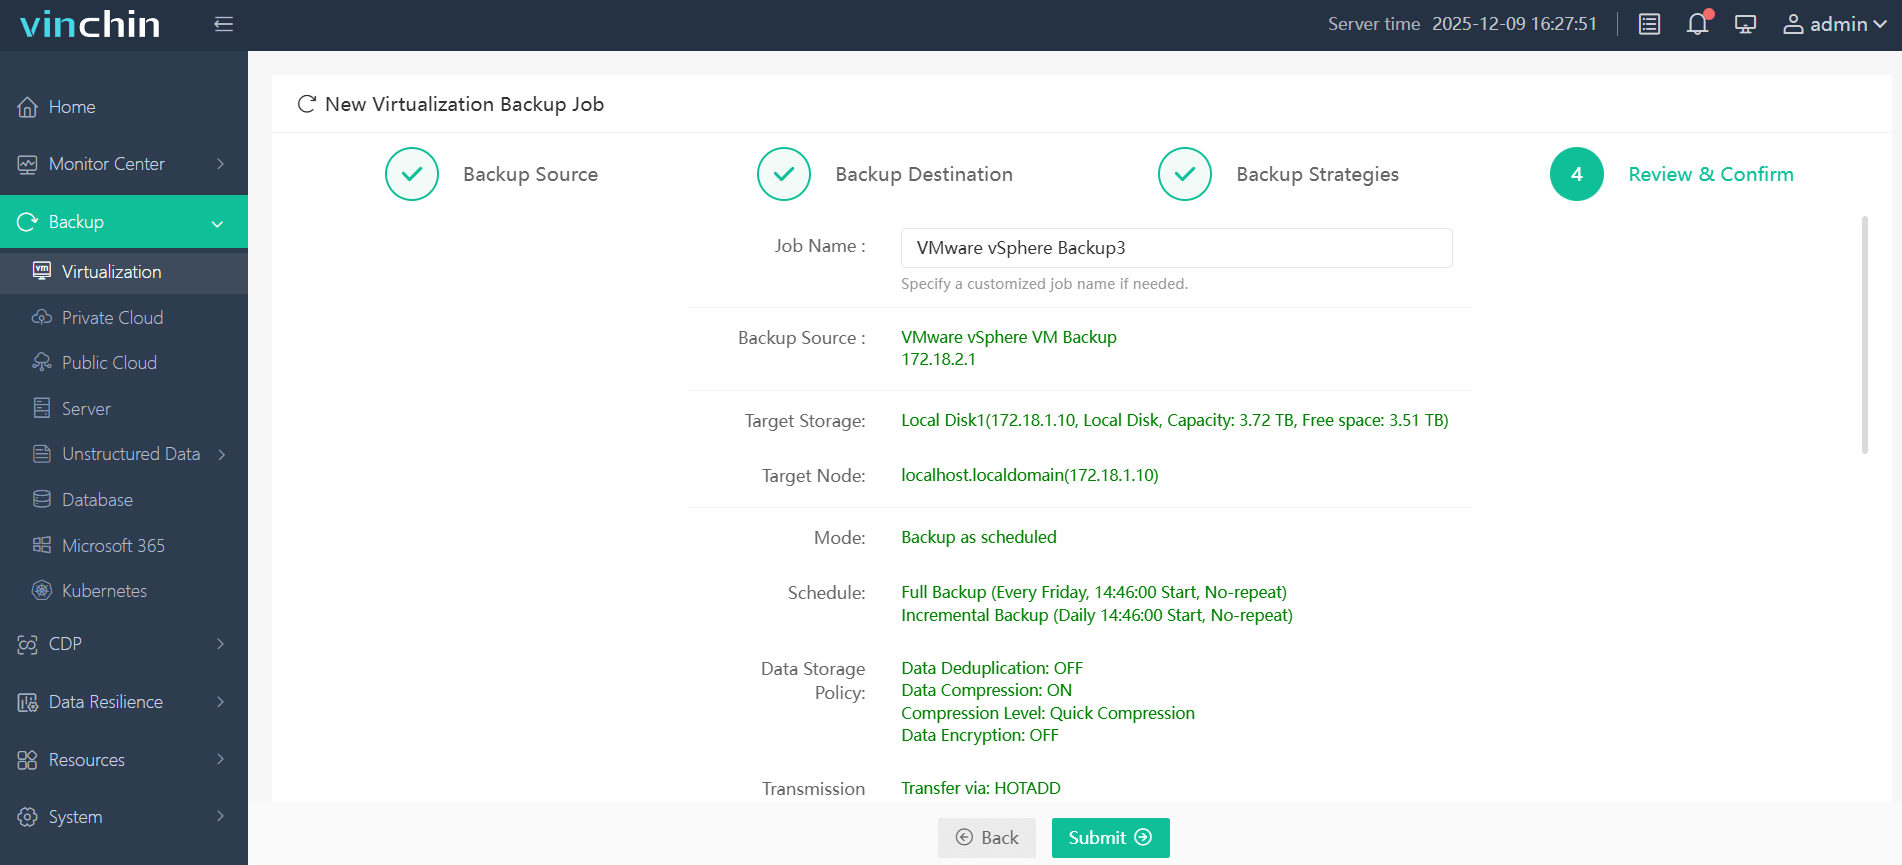
This streamlined process allows administrators at any skill level to schedule jobs flexibly while benefiting from advanced protection technologies behind the scenes.
Trusted globally by thousands of enterprises, with top ratings and proven reliability, Vinchin Backup & Recovery offers a fully featured 60-day free trial so you can experience comprehensive VM protection firsthand before purchase decisions are made.
VMware Log Analysis FAQs
Q1: How do I check if my ESXi host has run out of disk space due to large logs?
A1: Run df -h via SSH; check usage under /var.
Q2: What should I do if my syslog server stops receiving forwarded ESXi logs?
A2: Verify network connectivity first; then confirm syslog settings under Host > Manage > System > Advanced System Settings (Syslog.global.*) are correct on each host.
Q3: Can I limit which types of events get forwarded from my hosts?
A3: Yes; adjust filtering rules either within advanced syslog settings on each ESXi host or centrally through supported aggregation tools.
Conclusion
Regular vmware log analysis keeps systems stable while helping prevent downtime .Whether reviewing files manually ,using integrated dashboards ,or automating alerts, staying vigilant pays off long-term. For complete peace-of-mind ,protect workloads further using robust backup solutions like Vinchin.
If there's another scenario you'd like covered, or need deeper guidance on interpreting tricky entries, just ask!