-
What Are Kubernetes Metrics?
-
Why Monitor Kubernetes Metrics
-
Method 1: Collecting Kubernetes Metrics with Prometheus
-
Method 2: Collecting Kubernetes Metrics with Kubernetes Metrics Server
-
Key Metrics To Monitor In Production
-
How to Protect Kubernetes Workloads with Vinchin Backup & Recovery?
-
Kubernetes Metrics FAQs
-
Conclusion
Kubernetes metrics are your cluster’s vital signs. They reveal how nodes, pods, and applications perform at any moment. If you want reliable workloads and fast troubleshooting, you need to understand these numbers well.
Imagine this: one morning your app slows down without warning. Is it a memory leak? CPU spike? Without good metrics, you’re guessing—and that’s risky business for any administrator.
Kubernetes offers many ways to collect these insights across both control plane components (like API servers) and user workloads (pods running your apps). Let’s explore what these metrics are and how you can use them to keep your clusters healthy.
What Are Kubernetes Metrics?
Kubernetes metrics are data points that describe resource usage and system health inside your cluster. These include CPU load on nodes, memory consumption by pods, disk activity rates—even network traffic between services.
Metrics come in several types:
| Type | Description | Example Metric | Use Case |
|---|---|---|---|
| Counter | Increases only | Number of pod restarts | Detect crash loops |
| Gauge | Goes up or down | Current node CPU usage | Spot resource bottlenecks |
| Histogram | Shows value distribution over time | HTTP request latency histogram | Analyze response times |
When collecting metrics at scale, watch out for high cardinality—too many unique labels can slow down storage systems like Prometheus. Focus on key signals instead of tracking every possible label combination.
Kubernetes exposes these values through APIs such as /metrics endpoints on kubelets or via aggregated APIs like metrics.k8s.io. Tools like Prometheus or Metrics Server gather this data so you can view trends over time or trigger alerts when things go wrong.
Why Monitor Kubernetes Metrics
Monitoring kubernetes metrics is essential if you want stable clusters that scale smoothly under pressure. Here’s why:
First, proactive monitoring helps spot trouble early—before users notice outages or slowdowns. For example: if node memory climbs near its limit overnight due to a runaway process, timely alerts let you intervene before pods get evicted by the scheduler.
Second, kubernetes uses real-time resource data for automated scaling decisions via features like Horizontal Pod Autoscaler (HPA). If your monitoring isn’t accurate—or missing—you risk either wasting resources or failing to meet demand during traffic spikes.
Third comes troubleshooting power: when a pod crashes repeatedly at midnight but runs fine during the day, historical CPU/memory graphs help pinpoint whether it’s an application bug or infrastructure issue causing instability.
Finally: cost optimization matters! By tracking actual usage patterns over weeks or months using tools like Prometheus long-term storage backends, admins can right-size deployments instead of over-provisioning expensive cloud resources “just in case.”
In short: robust metric collection keeps clusters healthy while saving money—and headaches—for everyone involved.
Method 1: Collecting Kubernetes Metrics with Prometheus
Prometheus is an open-source monitoring powerhouse built for dynamic environments like Kubernetes. It scrapes data from endpoints exposed by nodes and workloads then stores everything as time-series records for querying later—or triggering alerts right away if something goes wrong!
How Prometheus Works in Kubernetes
Prometheus discovers targets automatically using service discovery mechanisms built into Kubernetes itself. It pulls raw numbers from /metrics endpoints on kubelets (for node stats), cAdvisor (for container stats), API servers (for control plane health), plus any custom exporters running alongside your apps.
You can visualize all this data using Grafana dashboards—or set up rules so Prometheus sends alerts when thresholds are crossed (“CPU above 90% for five minutes”).
Installing Prometheus in Your Cluster
The easiest way today is deploying via Helm charts:
1. Add the community Helm repository
   helm repo add prometheus-community https://prometheus-community.github.io/helm-charts
   helm repo update
2. Install kube-prometheus-stack
helm install kube-prometheus-stack prometheus-community/kube-prometheus-stack
3. Check deployment status
kubectl get pods -l "release=kube-prometheus-stack"
To access dashboards:
Retrieve Grafana admin password
kubectl get secret kube-prometheus-stack-grafana -o jsonpath="{.data.admin-password}" | base64 --decode ; echoForward Grafana port
kubectl port-forward svc/kube-prometheus-stack-grafana 3000:80
Open browser at http://localhost:3000; log in as admin with retrieved password
Sample Querying With PromQL
Want to see which pods use most memory? Try:
sum(container_memory_usage_bytes{container!="",pod!=""}) by (pod)This query sums up live memory usage per pod—a great way to spot heavy consumers quickly!
Or maybe track average CPU across all nodes:
avg(rate(node_cpu_seconds_total{mode="user"}[5m])) by (instance)Method 2: Collecting Kubernetes Metrics with Kubernetes Metrics Server
The Kubernetes Metrics Server is lightweight but powerful—it aggregates live resource usage across all nodes/pods so core features like autoscaling work seamlessly behind-the-scenes!
How Does It Work?
Metrics Server collects fresh stats from each node’s kubelet then exposes them through metrics.k8s.io API endpoints inside your cluster. This lets tools like kubectl top display instant snapshots of who’s using what right now—no waiting for batch jobs!
Unlike full-featured solutions such as Prometheus—which store historical trends—the Metrics Server focuses only on current state (“right now”). That makes it fast enough even for very large clusters where speed matters more than deep history retention.
Installing The Metrics Server
To deploy quickly:
kubectl apply -f https://github.com/kubernetes-sigs/metrics-server/releases/latest/download/components.yaml
This creates necessary deployments/service accounts/RBAC roles automatically based on latest stable release files maintained upstream.
Check deployment status:
kubectl get deployment metrics-server -n kube-system
Test functionality:
kubectl top nodes
kubectl top pods --all-namespaces
If output shows live numbers per node/pod—you’re good! If errors appear (“No resources found”), double-check RBAC permissions plus network connectivity between server pod(s) & individual node kubelets; TLS misconfiguration is another common culprit here.
Integrating With Horizontal Pod Autoscaler
Autoscaling relies heavily on real-time kubernetes metrics provided by the server! Here’s how it works:
Suppose you want web-app replicas scaled based on average CPU load above 50%. Create an HPA object:
apiVersion: autoscaling/v2
kind: HorizontalPodAutoscaler
metadata:
 name: web-app-hpa
spec:
 scaleTargetRef:
    apiVersion: apps/v1
    kind: Deployment
    name: web-app-deployment
 minReplicas: 2
 maxReplicas: 10
 metrics:
 - type: Resource
    resource:
      name: cpu
      target:
        type: Utilization
        averageUtilization: 50
Apply it (kubectl apply -f hpa.yaml). Now whenever average CPU crosses threshold—the number of replicas increases automatically based on live readings from the Metrics Server!
Advanced Configuration Tips
For very large environments (>100 nodes):
1. Edit deployment settings
kubectl edit deployment metrics-server -n kube-system
2. Adjust fields under resources.requests & resources.limits as needed
TLS issues? Make sure every kubelet has valid serving certificates matching its hostname/IP address; otherwise secure connections may fail silently.
Limitations To Know
Metrics Server does NOT store historical trends nor support custom application-level signals—it only reports current state needed by autoscalers & quick CLI checks (kubectl top). For deeper analysis/history use cases stick with solutions like Prometheus.
Key Metrics To Monitor In Production
Not all numbers matter equally! Here are some critical categories every admin should watch closely:
Control Plane Health
etcd database latency > 500ms = risk of slow scheduling/events loss
API server error rate >1% = possible overload/throttling
Node Level
MemoryPressure condition true = imminent OOM kills likely
DiskPressure true = risk of failed writes/data corruption
High disk IO wait times = underlying storage bottleneck
Workload Level
Container restart count rising rapidly = crash loop detected
Network error rate spikes = possible misconfigurations/DNS failures
Set warning thresholds based on normal baselines observed during quiet periods—not just vendor defaults! Alert fatigue happens fast if too many false positives flood inboxes daily.
How to Protect Kubernetes Workloads with Vinchin Backup & Recovery?
Vinchin Backup & Recovery delivers full and incremental backups; fine-grained restores at the level of individual clusters, namespaces, applications, PVCs, and resources; policy-based automation including scheduled and one-off jobs; strong security measures such as encrypted transmission/data-at-rest encryption/WORM protection; and high-performance capabilities like configurable multithreading/concurrent transfer streams that accelerate large-scale PVC operations. Together these features ensure reliable disaster recovery while simplifying management across heterogeneous multi-cluster environments—even supporting cross-version migration scenarios—all from a single pane of glass.
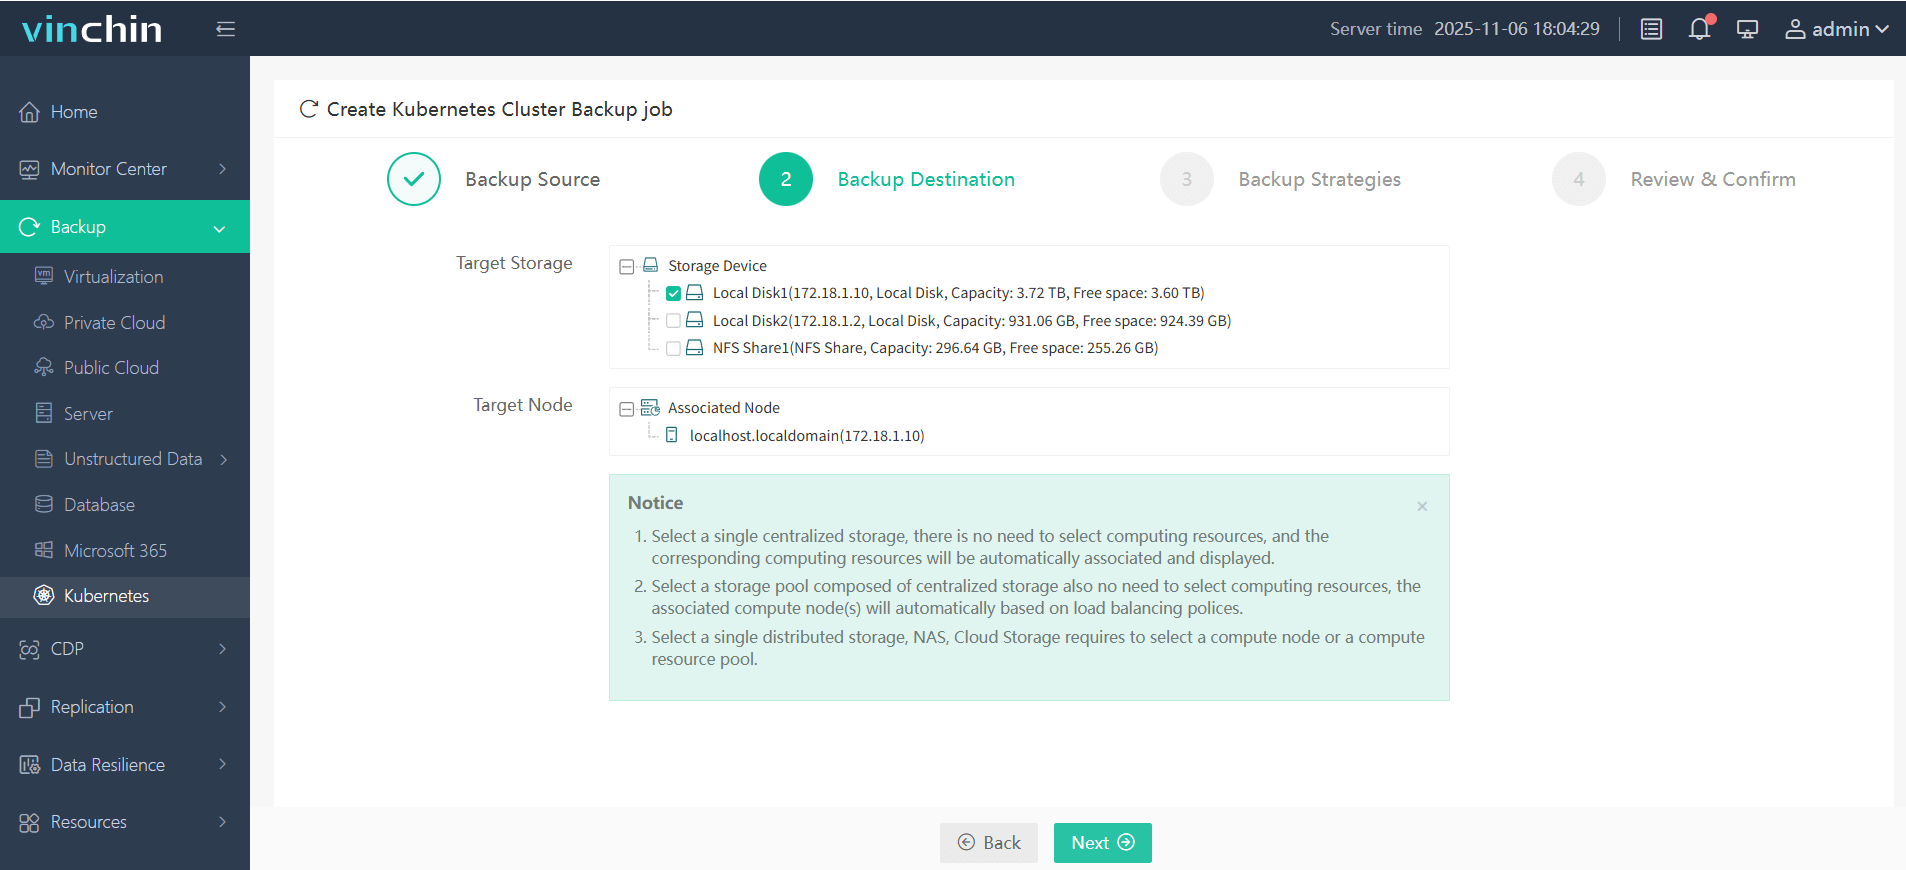
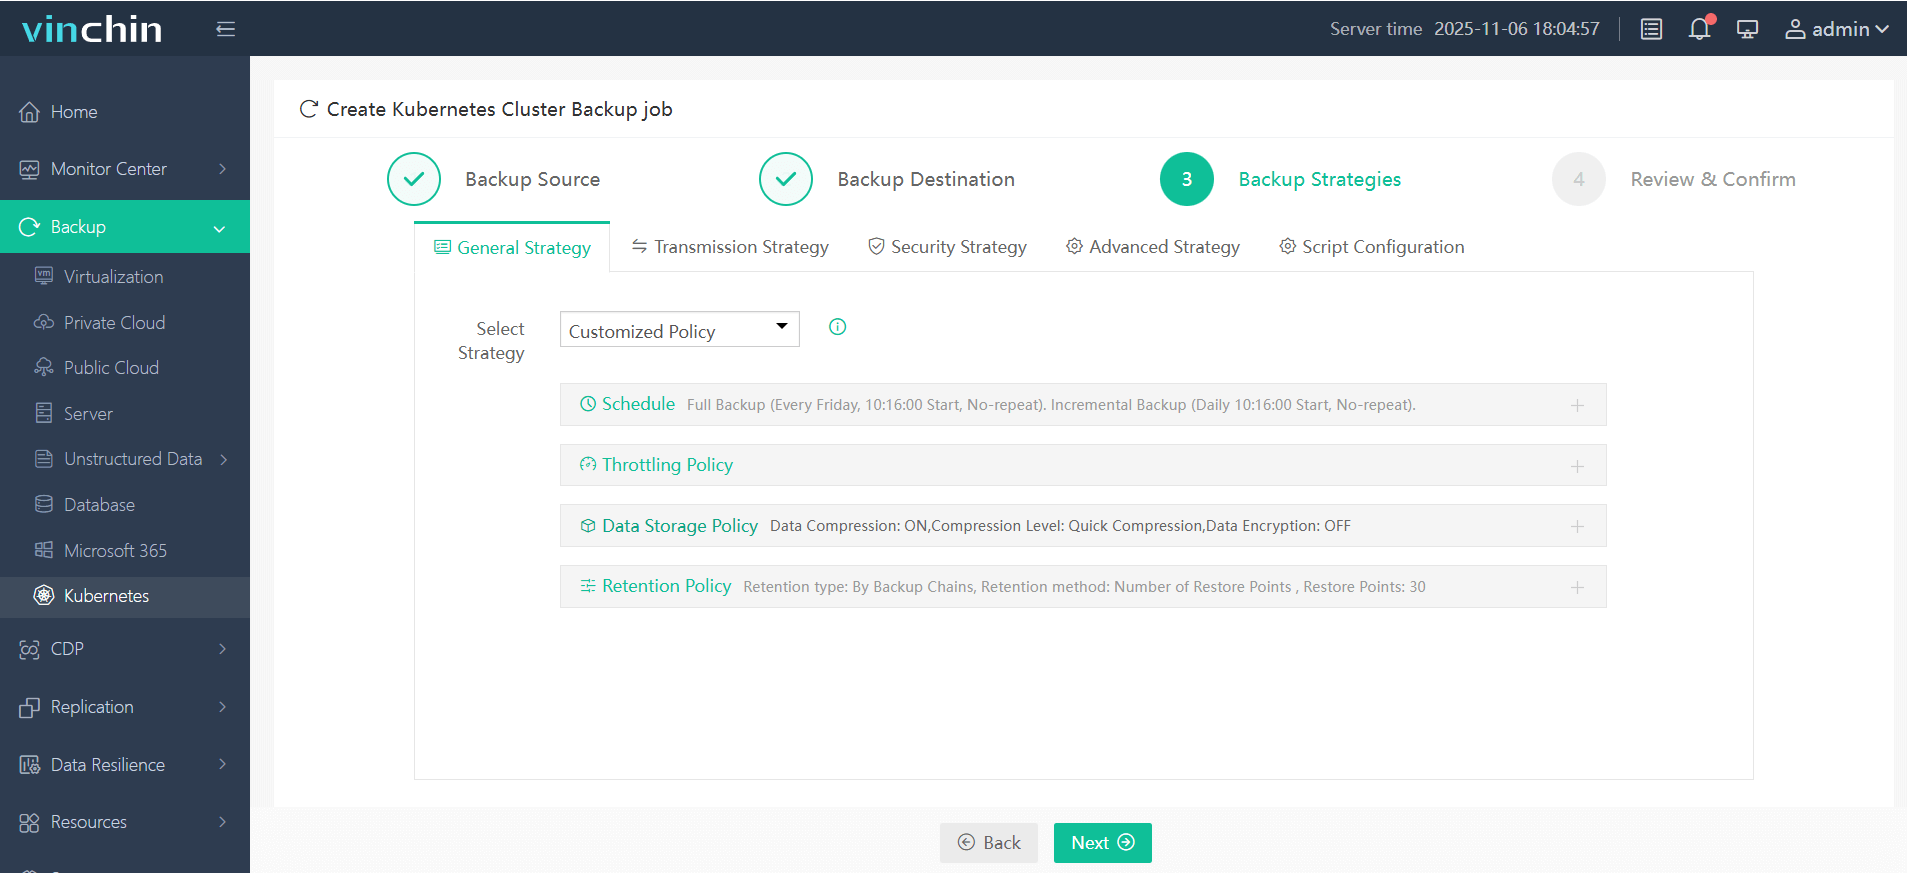
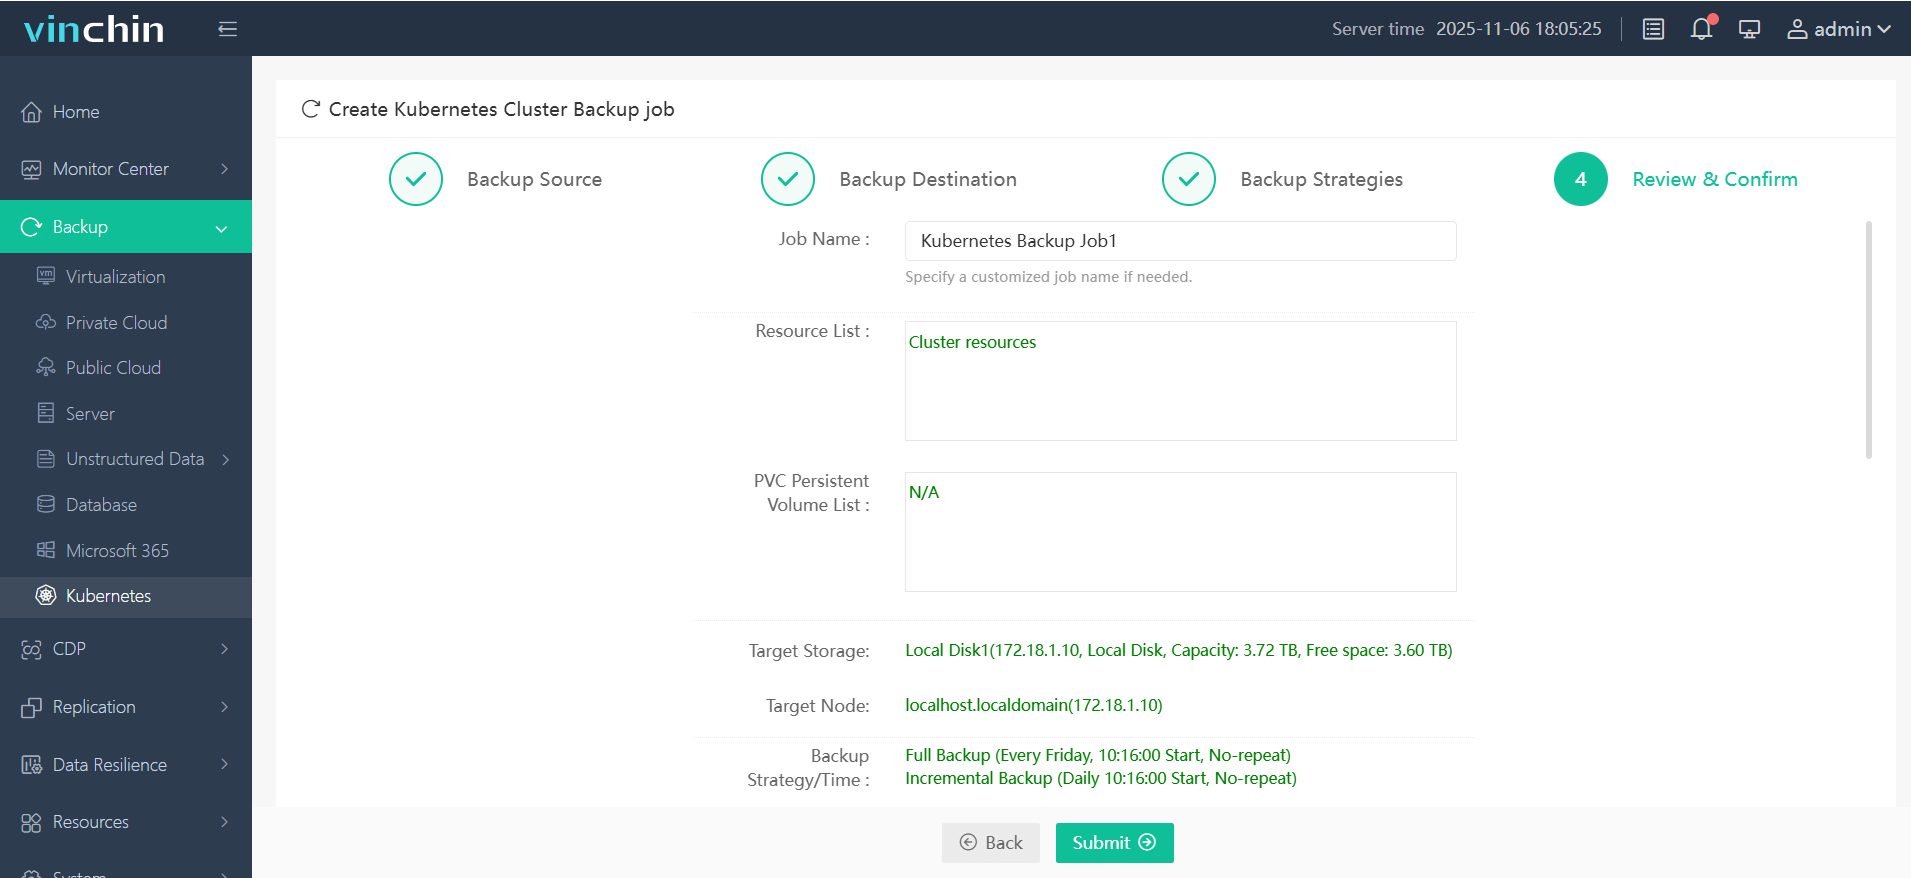
The intuitive web console makes protecting your Kubernetes workloads straightforward in just four steps:
1. Select the backup source

2. Choose the backup storage location

3. Define the backup strategy

4. Submit the job

Trusted globally by enterprises seeking secure containerized workload protection—with top ratings from customers—Vinchin Backup & Recovery offers a fully-featured free trial valid for sixty days so you can experience its benefits firsthand before committing further!
Kubernetes Metrics FAQs
Q1. How do I enable detailed logging if my metric queries return incomplete results?
A1 Set higher verbosity levels using --v=6 flag when launching relevant components such as kubelet/API server/controller-manager/logging sidecars.
Q2. What should I check first if my Horizontal Pod Autoscaler doesn’t react despite high load?
A2 Confirm that both target deployment exposes correct resource requests AND that live values appear under kubectl top; missing requests prevent scaling triggers.
Q3. Can I export selected metric snapshots outside my cluster without exposing sensitive internal endpoints?
A3 Yes—use read-only ServiceAccounts plus NetworkPolicies restricting egress traffic combined with external push gateways/proxies configured securely.
Conclusion
Kubernetes metrics help administrators monitor health at every level—from control plane internals down to individual containers’ behavior over time! Use tools like Prometheus for deep observability while relying on lightweight solutions such as the Metrics Server when speed counts most—and remember Vinchin makes protecting those workloads easy too!
Share on:


