-
What Is Prometheus in K8s?
-
Why Use Prometheus for Kubernetes Monitoring
-
How to Deploy Prometheus on K8s?
-
How to Set Up Prometheus on K8s Using Helm?
-
Protecting Your Kubernetes Data with Vinchin Backup & Recovery
-
Prometheus K8s FAQs
-
Conclusion
Kubernetes powers many of today’s cloud-native applications. But how do you know if your clusters are healthy? How can you spot problems before they affect users? That’s where Prometheus comes in. As the leading open-source monitoring tool for Kubernetes, Prometheus helps you collect, store, and analyze metrics from every part of your environment.
What Is Prometheus in K8s?
Prometheus is an open-source toolkit built for monitoring dynamic systems like Kubernetes clusters. It collects metrics as time series data—each metric has a timestamp and labels that describe its source or purpose.
In Kubernetes (often called “k8s”), Prometheus uses service discovery to find nodes, pods, and services through the Kubernetes API. This means it automatically tracks new workloads as they appear or disappear in your cluster.
Prometheus works on a pull model: it fetches data from endpoints exposed by system components or application containers at regular intervals. You can also set up alerting rules so Prometheus warns you when something goes wrong—like high CPU usage or failing pods.
This tight integration makes it easy to monitor everything from cluster health to application performance—all in one place.
Why Use Prometheus for Kubernetes Monitoring
Prometheus is popular among Kubernetes administrators because it fits natively into cloud-native workflows. Here’s why so many teams choose it:
First, automatic service discovery means you don’t have to update configs every time a pod changes—Prometheus finds them on its own using label selectors.
Second, its flexible data model lets you filter metrics by namespace, pod name, container label—or any custom tag you define.
Third, Prometheus integrates with visualization tools like Grafana so you can build dashboards that show exactly what matters most to your team.
Fourth, it supports powerful alerting through Alertmanager—you’ll get notified about issues before they become outages.
Finally, Prometheus scales well even as your cluster grows—and it’s backed by a strong open-source community.
With these features combined, Prometheus gives real-time insights into both infrastructure health and application behavior—a must-have for reliable operations.
How to Deploy Prometheus on K8s?
Deploying Prometheus manually gives you full control over configuration and security settings. Let’s walk through each step together—from basic setup to production-ready storage options.
1. Create a Namespace for Monitoring
Namespaces help organize resources in Kubernetes clusters. To keep things tidy:
kubectl create namespace monitoring
This command creates an isolated space just for monitoring tools like Prometheus and Grafana.
2. Set Up RBAC Permissions
Prometheus needs permission to read metrics from nodes and pods across your cluster—but granting too much access can be risky! Always tailor permissions based on your organization’s security policies.
Here’s an example clusterRole.yaml file:
apiVersion: rbac.authorization.k8s.io/v1
kind: ClusterRole
metadata:
  name: prometheus
rules:
- apiGroups: [""]
  resources:
    - nodes
    - nodes/proxy
    - services
    - endpoints
    - pods
  verbs: ["get", "list", "watch"]
- apiGroups:
    - extensions
  resources:
    - ingresses
  verbs: ["get", "list", "watch"]
- nonResourceURLs: ["/metrics"]
  verbs: ["get"]
---
apiVersion: rbac.authorization.k8s.io/v1
kind: ClusterRoleBinding
metadata:
  name: prometheus
roleRef:
  apiGroup: rbac.authorization.k8s.io
  kind: ClusterRole
  name: prometheus
subjects:
- kind: ServiceAccount
  name: default
  namespace: monitoring
Apply this policy with:
kubectl apply -f clusterRole.yaml
If your organization uses custom service accounts or stricter policies, adjust this YAML accordingly!
3. Configure Persistent Storage (Production Best Practice)
By default, some guides use emptyDir volumes—which erase all data if the Pod restarts or moves! For production environments where metric history matters:
First create a PersistentVolumeClaim (PVC):
apiVersion: v1
kind: PersistentVolumeClaim
metadata:
  name: prometheus-pvc
  namespace: monitoring
spec:
  accessModes:
    - ReadWriteOnce
  resources:
    requests:
      storage: 10Gi
Apply with kubectl apply -f pvc.yaml.
Then update your Deployment YAML under volumes like this:
volumes:
- name: prometheus-storage-volume
  persistentVolumeClaim:
    claimName: prometheus-pvc
And under volumeMounts, keep using /prometheus/ as the mount path.
Persistent storage ensures that even if Pods move between nodes—or restart unexpectedly—your historical metrics remain safe!
4. Create ConfigMap for Scrape Configuration
Prometheus needs instructions on which targets to scrape—and how often! Place these settings in a ConfigMap (config-map.yaml). For example:
apiVersion: v1
kind: ConfigMap
metadata:
   name: prometheus-server-conf
   namespace: monitoring
data:
   prometheus.yml : |-
     global :
       scrape_interval : '15s'
     scrape_configs :
       - job_name : 'kubernetes-nodes'
         kubernetes_sd_configs :
           - role : node
         relabel_configs :
           ...
Apply with:
kubectl apply -f config-map.yaml
If there are errors here—like typos or missing jobs—the Pod may fail with CrashLoopBackOff. Always check logs using:
kubectl logs <pod-name> -n monitoring
5. Deploy the Prometheus Server
Now deploy using an updated YAML file (prometheus-deployment.yaml) referencing both config volume and PVC:
apiVersion : apps/v1
kind : Deployment
metadata :
   name : prometheus-deployment
   namespace : monitoring
spec :
   replicas : 1
   selector :
     matchLabels :
        app : prometheus-server
   template :
     metadata :
        labels :
          app : prometheus-server
     spec :
        containers :
          - name : prometheus
            image : prom/prometheus:v2.x.x
            args :
              - "--storage.tsdb.retention.time=12h"
              - "--config.file=/etc/prometheus/prometheus.yml"
              - "--storage.tsdb.path=/prometheus/"
            ports :
              - containerPort : 9090
            volumeMounts :
              - name : prometheus-config-volume
                mountPath : /etc/prometheus/
              - name : prometheus-storage-volume
                mountPath : /prometheus/
        volumes :
          - name : prometheus-config-volume
            configMap :
               defaultMode : 420
               name : prometheus-server-conf
          - name : prometheus-storage-volume
            persistentVolumeClaim :
               claimName : prometheus-pvc
Apply with:
kubectl apply -f prometheus-deployment.yaml
Accessing the Dashboard Safely
To view metrics via browser without exposing ports publicly:
Get Pod Name dynamically:
POD=$(kubectl get pods --namespace monitoring \
-l "app=prometheus-server" \
-o jsonpath="{ .items[0].metadata.name }")

kubectl port-forward $POD --namespace monitoring \
8080:9090
Open http://localhost:8080 — now you’re ready to explore queries!
How to Set Up Prometheus on K8s Using Helm?
Helm simplifies deploying complex applications by packaging them into charts—including all dependencies like exporters or dashboards! The kube-prometheus-stack chart bundles everything needed for robust observability out-of-the-box.
Quick Start With Helm Chart
First add the official repository then update local cache:
helm repo add prometheus-community https://prometheus-community.github.io/helm-charts

helm repo update
Install into its own namespace:
helm install prometheus \
prometheus-community/kube-prometheus-stack \
--namespace monitoring --create-namespace
Wait until all Pods show STATUS Running:
kubectl get pods --namespace monitoring
If any Pods stay Pending or CrashLoopBackOff longer than expected,
check events via:
kubectl describe pod <pod-name> --namespace monitoring
Accessing Dashboards
Forward local port:
kubectl port-forward --namespace monitoring \
svc/prometheus-kube-prom-stack-prometheu...\
9090:9090
Visit http://localhost:9090 — here is your live dashboard!
Grafana is included too; forward its port:
kubectl port-forward --namespace monitoring \
svc/prometheu...grafana \
3000:80
Default login is admin/prom-operator unless changed during install.
Customizing Your Helm Installation
You may want different retention times,
enable extra exporters,
or tweak resource limits.
Instead of editing defaults directly,
create a custom values file (values.yaml) such as:
serverFiles.prometheu...yml.global.scrape_interval="30s"
server.persistentVolume.size="20Gi"
alertmanager.enabled=true
grafana.adminPassword="mysecurepassword"
resources.requests.cpu="1000m"
resources.limits.memory="2Gi"
...
Then install using:
helm install my-monitoring-stack \
prometheu...kube-prometh...stack \
-f values.yaml --namespace monitoring
This approach keeps upgrades smooth since changes live outside upstream chart code.
Protecting Your Kubernetes Data with Vinchin Backup & Recovery
For organizations seeking robust protection beyond manual scripting and native limitations, Vinchin Backup & Recovery stands out as an enterprise-grade solution purpose-built for comprehensive Kubernetes backup. It delivers advanced capabilities such as full/incremental backups at multiple granularities—including cluster-, namespace-, application-, PVC-, and resource-level protection—as well as policy-based scheduling options and rapid cross-cluster restores. With features like intelligent automation, encrypted transmission/storage, WORM protection against ransomware threats, configurable multithreading for high-speed PVC throughput, and seamless migration across heterogeneous multi-cluster environments or different K8s versions/storage backends, Vinchin Backup & Recovery enables IT teams to safeguard complex infrastructures efficiently while minimizing operational overhead.
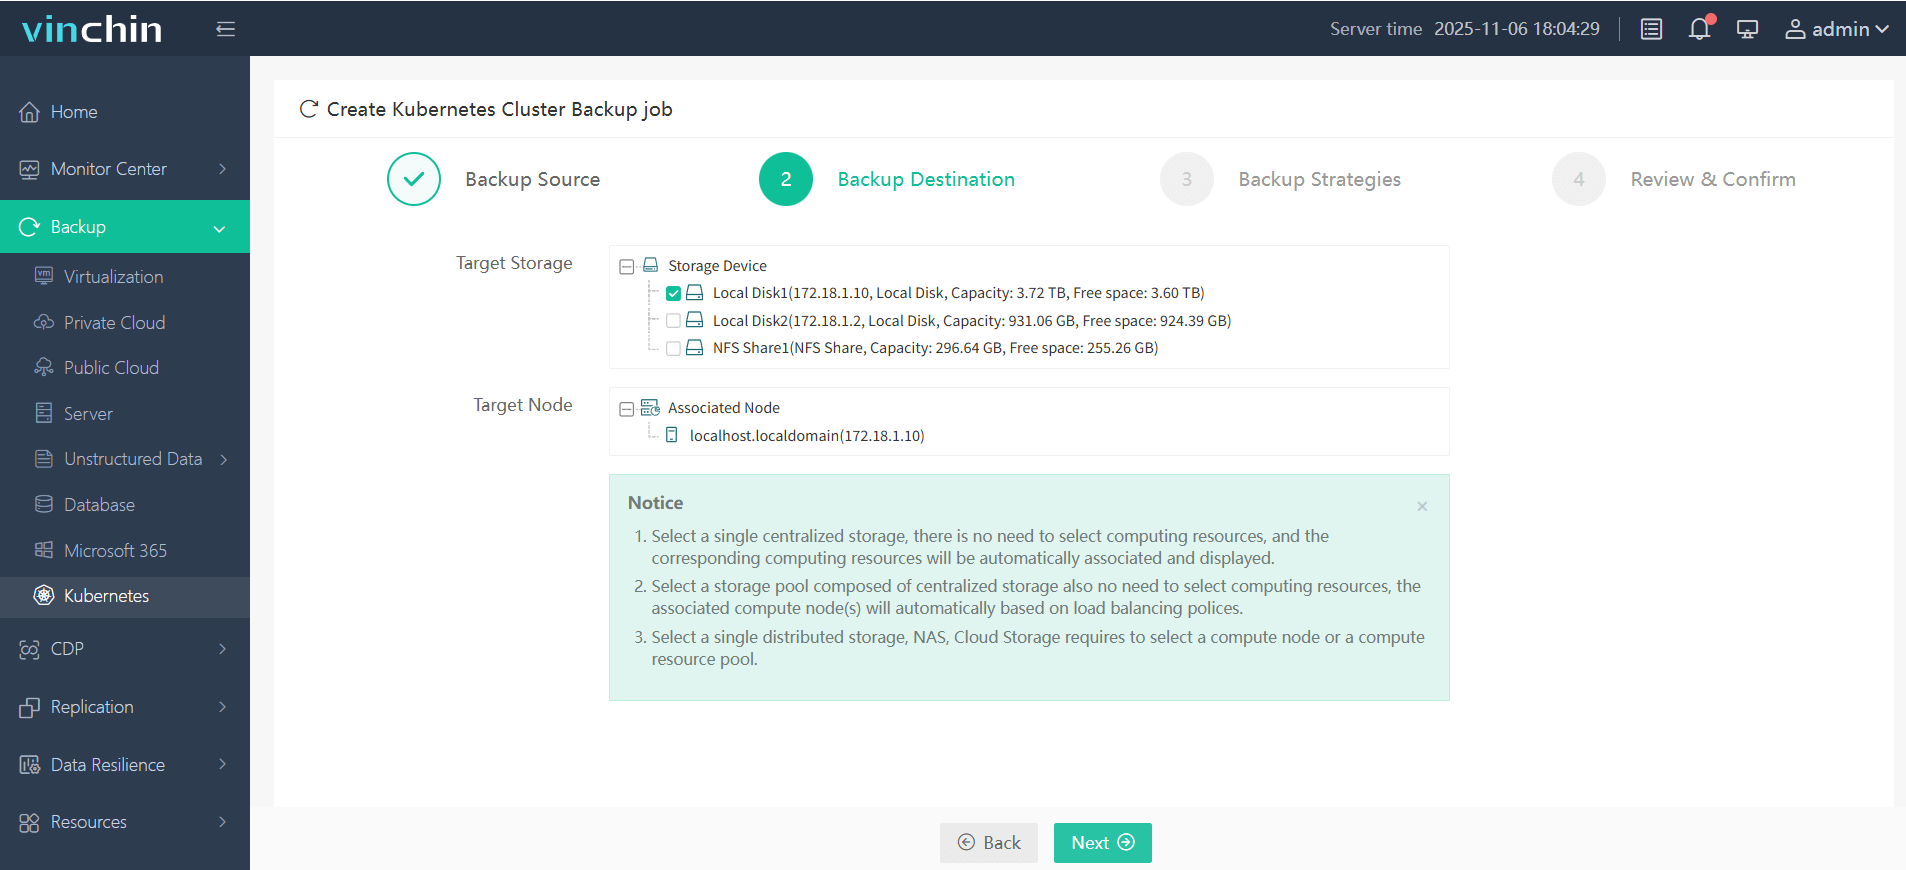
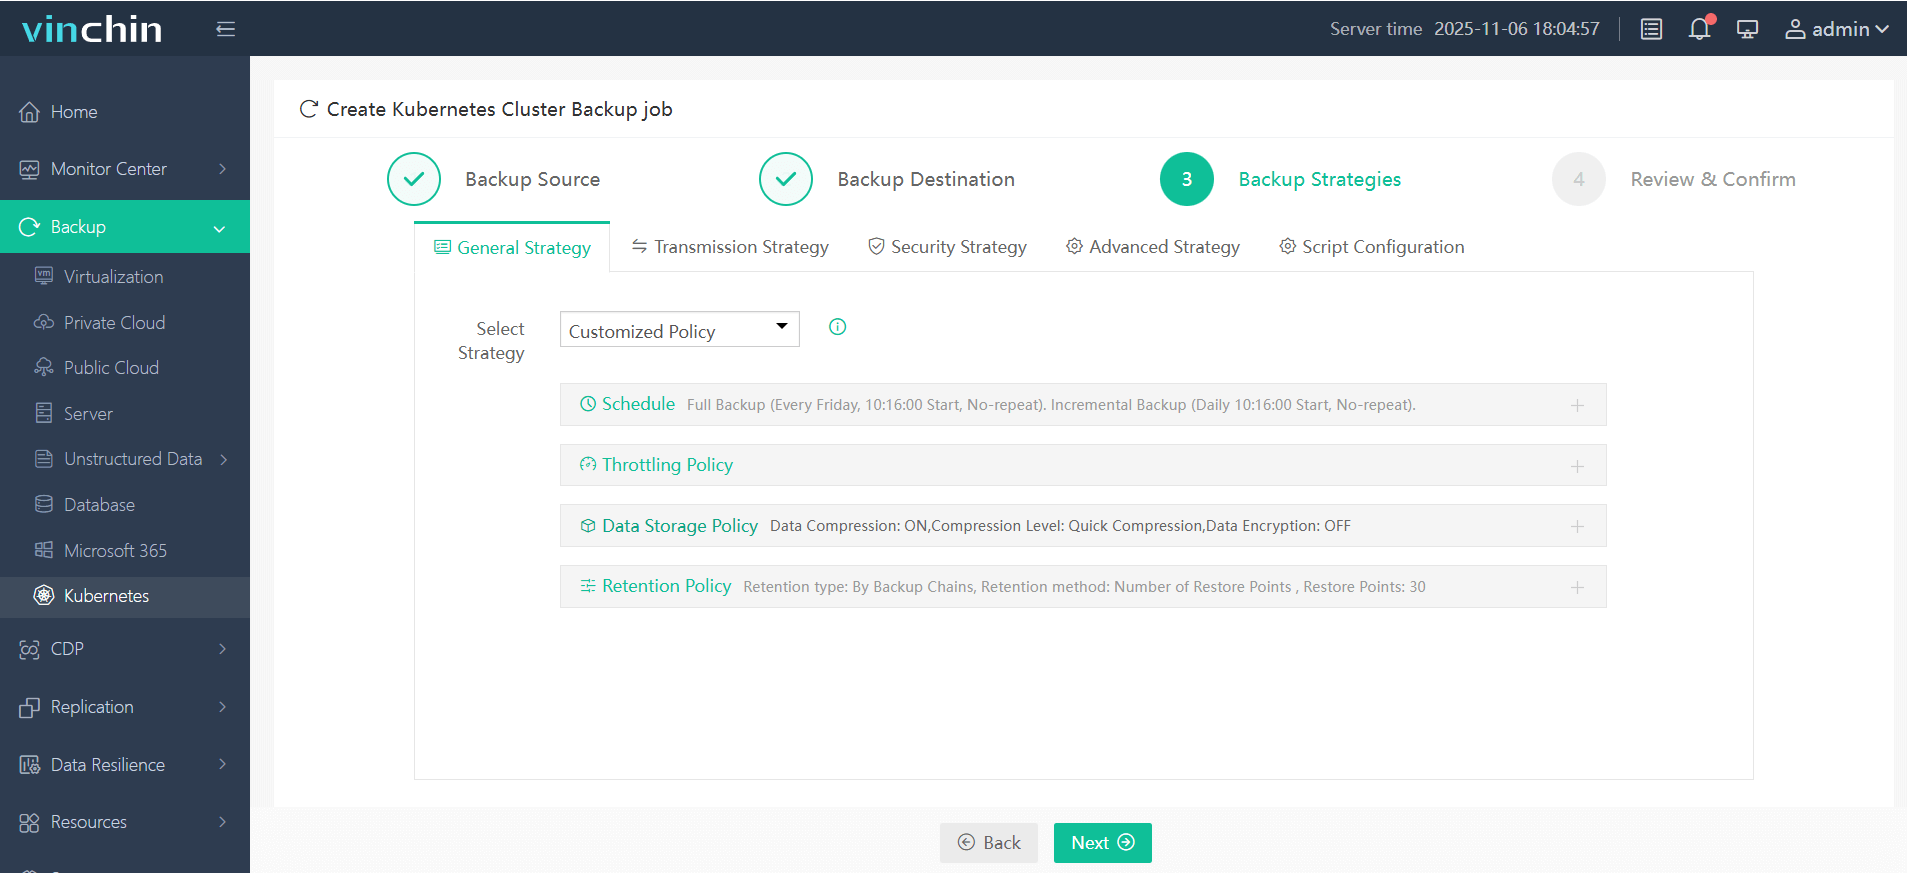
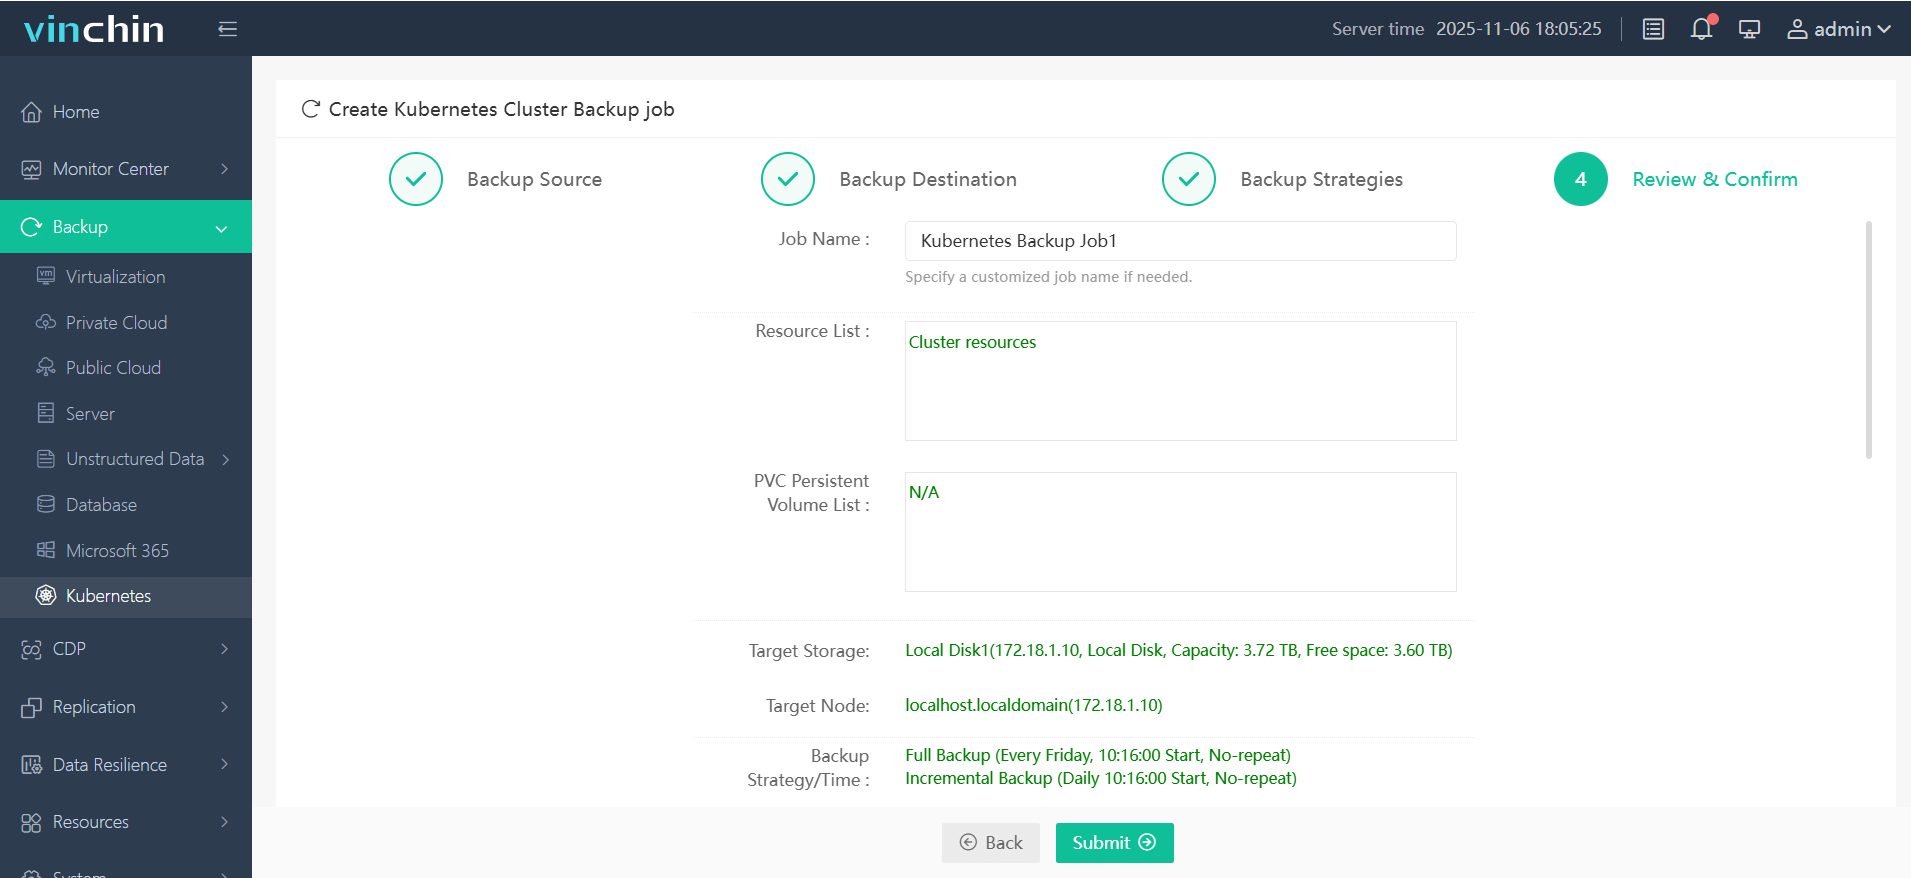
The intuitive web console makes safeguarding your Kubernetes environment straightforward in just four steps:
1. Select the backup source

2. Choose the backup storage location

3. Define the backup strategy

4. Submit the job

Recognized globally with top ratings among enterprise customers worldwide, Vinchin Backup & Recovery offers a fully featured free trial valid for 60 days—experience industry-leading simplicity and reliability firsthand by clicking download below.
Prometheus K8s FAQs
Q1 How can I monitor custom microservices running inside my k8s cluster?
A1 Expose their /metrics endpoint then define either ServiceMonitor or PodMonitor objects so that Prometheu...scrapes those targets automatically within configured namespaces.
Q2 What should I do if my persistent volume runs out of space?
A2 Expand underlying PV/PVC size via cloud provider tools then edit StatefulSet/deployment specs accordingly; always monitor disk usage trends proactively!
Q3 Can I integrate external databases (outside k8s) into my cluster-wide dashboards?
A3 Yes—add static_configs entries inside prometheu...yml, specifying external IP addresses plus authentication details as needed.
Conclusion
Prometheu...offers deep visibility into every layer of modern k8s infrastructure—from basic health checks up through detailed application analytics. Manual deployments give fine-grained control while Helm streamlines upgrades at scale. For backup peace-of-mind, Vinchin delivers enterprise-grade protection tailored specifically for mission-critical kubernetes environments.
Share on:


