Plan for 1.5x to 3x the total provisioned size of your VM disks for the first 30 days of backup storage, then add roughly 3-8% of source data size per additional day of retention once deduplication is active. A typical mixed workload (database, file servers, application servers) with 30-day retention, daily incrementals, and moderate deduplication lands around 1.8x-2.2x source data size in steady state. Storage-heavy workloads with high change rates (databases, video, CI/CD build servers) can require 3x-5x, while static, low-change VMs (domain controllers, DNS, read-only file shares) can often run under 1.5x. There is no single universal number — the formula in this article lets you calculate your own.
Key Takeaways
Backup storage is a function of five variables: source data size, daily change rate, retention period, backup type (full/incremental/synthetic), and deduplication/compression ratio — not a fixed multiplier.
Change rate is not constant across the retention window; it spikes around patch cycles, month-end batch jobs, and database maintenance, which is the single most common cause of underestimated storage.
Storage cost per additional retention day shrinks the longer you already retain data, because deduplication finds more matches inside a larger backup set — retention isn't linear.
Deduplication ratios of 10:1 to 50:1 are commonly reported for backup workloads, but the realistic planning range for mixed VM fleets is closer to 5:1-15:1 once you exclude best-case, single-workload examples.
Change-tracking technology (VMware CBT, Hyper-V RCT, Proxmox dirty bitmaps) determines how efficiently incrementals capture only true deltas — misconfigured or reset tracking silently reverts jobs to full-size backups.
Backup storage tends to grow faster than production storage over multi-year horizons because retention windows and VM count both increase independently — a compounding effect most capacity plans don't model.
What Determines VM Backup Storage Requirements
VM backup storage consumption is set by five interacting variables, and estimates go wrong almost every time because one of them is treated as fixed when it isn’t:
Source data size - the actual used capacity inside each VM’s virtual disks, not the provisioned disk size. A 500 GB thin-provisioned disk with 120 GB used should be sized against 120 GB, not 500 GB, provided the backup software is thin-aware.
Daily change rate - the percentage of blocks that change between two backup points. This is the variable most estimates get wrong, covered in detail below.
Retention period - how many restore points you keep and for how long, which determines how many incremental deltas accumulate before they age out.
Backup type and schedule - full, incremental, differential, or forever-incremental with synthetic fulls, each with a different storage growth curve.
Deduplication and compression ratio - how much of the redundant data across VMs' disks, and time gets collapsed before it consumes physical capacity.
Every other factor commonly cited - number of VMs, hypervisor platform, backup software vendor - it's really just a modifier on one of these five. That’s why a reliable estimate has to be built from a formula rather than a rule of thumb copied from a different environment.
The Core VM Backup Storage Sizing Formula
The most reliable way to estimate backup storage is to separate the one-time cost of the first full backup from the recurring cost of each retained restore point, then apply a deduplication/compression factor to the total before adding a safety buffer.
Total Backup Storage ≈
(Source Data Size × Full Backup Compression Factor)
+ (Source Data Size × Daily Change Rate × Retention Days × Incremental Compression Factor)
− Deduplication Savings Across Restore Points
+ Buffer (20-30%)
We use a single multiplier to make this formula usable without a spreadsheet for every VM: the Storage Amplification Factor, defined as total retained backup storage divided by source data size. SAF collapses change rate, retention length, backup type, and dedup ratio into one number you can apply per workload class, and it moves in a predictable, non-linear way as those inputs shift. In practice, SAF clusters into recognizable bands rather than a smooth curve, because change rate and retention interact in discrete steps, a VM doesn't gradually shift from "low change" to "high change"; it jumps categories when its role changes (a file server becomes a build agent, a reporting DB starts nightly reindexing). Tracking SAF by workload role instead of by VM count is what actually predicts future storage consumption; tracking it by VM count is what causes capacity planning to be wrong every single quarter.
Workload class | Typical daily change rate | SAF at 30-day retention | SAF at 90-day retention |
Static infrastructure (DNS, domain controllers, read-only shares) | 0.1%-0.5% | 1.2x-1.4x | 1.5x-1.8x |
General file/print/web servers | 1%-3% | 1.6x-2.0x | 2.2x-2.8x |
Application servers, mail servers | 3%-6% | 2.0x-2.6x | 3.0x-4.0x |
Transactional database | 5%-15% | 2.5x-3.5x | 4.0x-6.0x |
Analytics/logging/build systems | 10%-25% | 3.0x-5.0x | 5.0x-9.0x |
These bands assume forever-incremental scheduling with periodic synthetic fulls and a moderate dedup/compression factor (roughly 2:1 to 4:1 combined). They are planning ranges, not guarantees, always validate against 2-4 weeks of measured change-rate data before committing to a purchase.
Full vs. Incremental vs. Differential vs. Forever-Incremental Storage Math
The backup schedule you choose changes the storage curve shape, not just the total:
Full backups every cycle consume the most storage, every restore point is a complete, independent copy of source data size (before compression). Storage grows linearly with the number of retained fulls: retain 10 weekly fulls, pay for roughly 10x source data (minus whatever compression buys back).
Full + differential takes one full backup, then each differential captures everything changed since that full, so differentials grow larger each day until the next full resets them. Storage is more efficient than full-only but grows in a sawtooth pattern that peaks right before each new full.
Full + incremental captures only the delta since the previous backup (full or incremental), keeping each restore point small, but restores require replaying the full chain, and storage accumulates as a long dependency chain unless periodically consolidated.
Forever-incremental with synthetic fulls takes one true full backup ever, then builds all subsequent “fulls” synthetically from existing blocks plus new incrementals, no repeated full reads from production. This is the most storage-efficient pattern for ongoing operations and is the default approach most modern VM backup platforms use.
The practical implication: if a storage estimate doesn’t specify which of these four patterns it assumes, the number is close to meaningless, full-only and forever-incremental can differ by 5-10x in steady-state storage for the same retention period.
Change Rate: The Variable Everyone Underestimates
Daily change rate is usually estimated as a single flat percentage pulled from a vendor’s “typical” range. That number is almost always wrong for planning purposes, because change rate is not constant across a retention window, it spikes predictably around specific events.
Most storage estimates treat daily change rate as flat: “this VM changes 3% per day, so 30 days of incrementals is 90% of source size.” In practice, change rate follows a recognizable shape we call the Change Rate Decay Curve, a baseline rate punctuated by regular spikes that are 3x-8x the baseline, driven by predictable operational events rather than random data drift:
Patch cycles - monthly OS and application patching can touch 5-15% of a VM's blocks in a single day, even on otherwise low-change systems, because patch installers rewrite system files, registries, and package databases broadly rather than surgically.
Database maintenance windows - index rebuilds, statistics updates, and log truncation can rewrite large contiguous regions of a database VM's disk on a schedule (often weekly or monthly) that has nothing to do with normal transactional change rate.
Month-end and quarter-end batch processing - financial, reporting, and ERP systems frequently show change-rate spikes tied to close-of-period jobs that don't appear in a "typical week" sample.
Antivirus/EDR definition updates and full disk scans - signature updates and scheduled full scans can touch metadata across the entire filesystem, inflating apparent change rate on VMs that otherwise look static.
A change-rate sample taken during a quiet week will systematically underestimate storage, because it misses these spikes entirely. Sizing off a single week's average change rate is one of the most common causes of backup storage running out mid-quarter, not because the VM's "typical" change rate was measured wrong, but because the sample window didn't include a patch cycle or a maintenance job. The fix is to size against the 95th-percentile daily change rate over a full month, not the average.
Retention Policy and the Retention Curve Inflection Point
Retention period is usually assumed to scale storage linearly - twice the retention days, roughly twice the storage. That assumption holds only for the first stretch of a retention window; beyond a certain point, it breaks down. Retention length itself should be a deliberate policy decision tied to data criticality rather than a default setting: federal contingency-planning guidance recommends the backup frequency and retention be set explicitly based on data criticality and how often new information is introduced, rather than left at a platform default. (NIST SP 800-34 Rev.1)
We call the point at which the marginal storage cost per additional retention day starts to decline the Retention Curve Inflection Point. It happens because deduplication operates across the entire retained backup set, not per restore point — as the set grows, the probability that any given new block already exists somewhere in the existing set increases, so each additional day of retention contributes progressively less net new physical storage even though it adds a full logical restore point. A daily full backed up with 1% daily change and retained for 30 backups can reach roughly a 30:1 deduplication ratio, while the same VM retained weekly for a month reaches only around 4:1, the difference isn't the data, it's how densely the dedup domain samples the same changing blocks (TechTarget).
The practical consequence: extending retention from 30 to 60 days rarely doubles storage, it typically adds 40-70% more, and extending from 90 to 180 days often adds even less proportionally, because you're now deduplicating against a much larger existing set. This is good news for compliance-driven long-retention requirements, but it also means short-retention windows are proportionally more expensive per protected day than most people assume, since there isn't yet enough accumulated data for dedup to find matches.
Deduplication and Compression: Realistic Ratios by Data Type
Reported deduplication ratios vary enormously depending on what’s being measured, and vendor marketing materials tend to quote best-case numbers from homogeneous, low-change environments. A useful planning rule: local, in-line deduplication on backup workloads commonly falls in the 10:1 to 50:1 range under favorable conditions - high VM template similarity, low change rate, long retention - but mixed production fleets with varied OS versions, encrypted application data, and moderate-to-high change rate typically land closer to 5:1-15:1 in practice.
Data type | Realistic dedupe + compression range | Why |
OS system volumes (from shared templates) | 15:1-40:1 | High block-level similarity across VMs built from the same image |
General file/document data | 3:1-8:1 | Text and office formats compress well; less cross-VM duplication |
Databases (uncompressed dumps) | 4:1-10:1 | Row-level redundancy helps, but active pages change constantly |
Pre-compressed media, video, backups-of-backups | 1:1-1:3x | Already-compressed data has little redundancy left to exploit |
Encrypted application data (databases with TDE, encrypted volumes) | ~1:1 | Encryption randomizes data, defeating pattern-based deduplication entirely |
The order of operations matters as much as the ratio: deduplication and compression must run before encryption, because encrypted data has no exploitable redundancy. Backup platforms that encrypt at the source before deduplication will see storage consumption close to the unprotected size regardless of the theoretical dedup ratio.
Why Backup Storage Grows Faster Than Production Storage
Production storage growth and backup storage growth are usually planned as if they move together, but they compound independently, and backup storage almost always wins the race over a multi-year horizon. Enterprise data volumes are forecast to keep growing at a pace that outstrips installed storage capacity growth (IDC Global DataSphere Forecast), and that base growth rate applies to production data. Backup storage then compounds on top of it through two additional multipliers production storage doesn’t experience: retention windows tend to lengthen over time (compliance requirements rarely shrink), and VM count grows independently of per-VM data growth (new projects, new environments, test/dev sprawl).
The result is a Backup Storage Drift Ratio - the widening gap between production storage growth rate and backup storage growth rate - that most capacity plans miss because they extrapolate backup storage as a fixed multiple of current production storage rather than modeling retention-window growth and VM-count growth as independent variables. A team that budgets backup storage as "2x production storage, reviewed annually" will consistently underbuy, because both the multiplier's inputs are moving upward at the same time the review cadence assumes they're static.
Work Sizing Example
Assume a mixed environment of 40 VMs, 15 TB total used source data, forever-incremental backups with weekly synthetic fulls, 30-day retention, and a blended dedup/compression factor of 8:1 (mid-range for a mixed fleet):
Step | Calculation | Result |
Initial full backup (compressed ~2:1 before dedup) | 15 TB ÷ 2 | 7.5 TB |
30 days of incrementals at blended 4% daily change rate | 15 TB × 4% × 30 days | 10 TB (logical) |
Apply blended dedup/compression to incrementals (8:1) | 18 TB ÷ 8 | 2.25 TB |
Subtotal (physical) | 7.5 TB + 2.25 TB | 9.75 TB |
Add 25% buffer for growth and change-rate spikes | 9.75 TB × 1.25 | ~12.2 TB |
That resolves to an SAF of roughly 0.81x physical-to-logical for this environment - well below 1x because of dedup and compression, even though the logical data protected (15 TB × multiple restore points) is far larger. This is the gap that confuses: source data size and physical backup storage consumption are related but not directly comparable once dedup is active, and quoting “SAF” without specifying whether it’s measured against logical or physical consumption is a common source of mismatched estimates between vendors.
VM Backup Storage Sizing Workflow
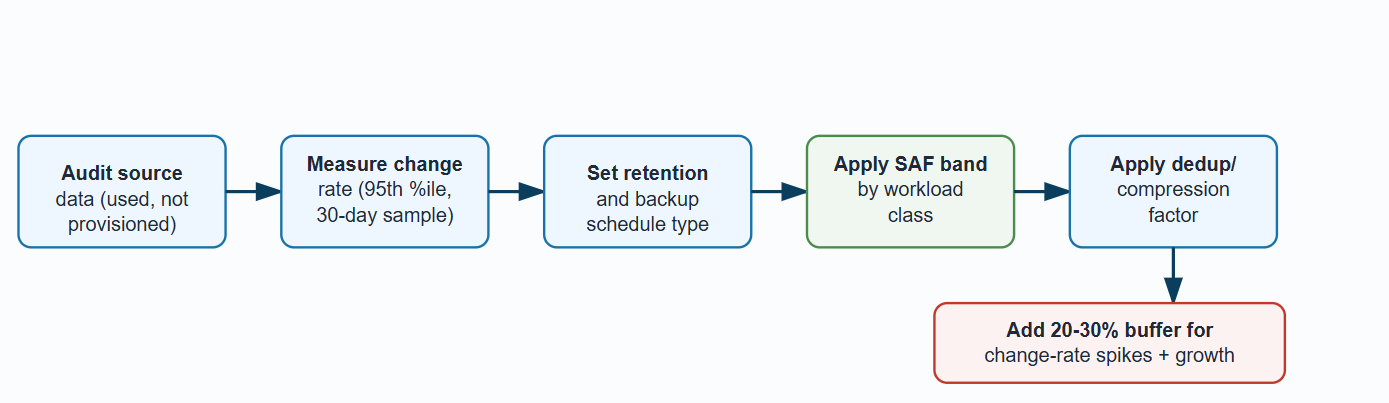
Storage Requirements by Virtualization Platform
The formula above is platform-agnostic, but how efficiently a hypervisor’s change-tracking technology captures true deltas has a direct, measurable effect on incremental backup size, and misconfigured tracking is one of the most common reasons real-world storage consumption exceeds the calculated estimate.
VMware vSphere
VMware’s Changed Block Tracking (CBT) is a native feature that logs modified disk blocks in a tracking file at the ESXi storage stack level, allowing backup software to request only changed blocks instead of scanning the entire virtual disk (Broadcom knowledge base). CBT is not enabled by default on every VM and must be active before the first snapshot for incrementals to be efficient; if CBT resets (common after certain snapshot consolidation issues, storage vMotion events, or disk expansion), the next backup silently reverts to a full-size read, which is a frequent, hard-to-diagnose cause of unexpected storage spikes in VMware environments.
Microsoft Hyper-V
Hyper-V uses Resilient Change Tracking (RCT), a built-in feature for Windows Server 2016 and later that tracks disk-block changes at the VHDX level between backup operations, feeding incremental-forever backup chains without requiring third-party filter drivers (IBM documentation). RCT requires VM configuration version 6.2 or later, VMs migrated from older Hyper-V hosts may need a version upgrade before efficient incrementals are possible, and until that upgrade happens, backups behave as if change tracking isn't available at all.
Proxmox VE
Proxmox VE uses QEMU-level “dirty bitmaps” to track changed blocks on running VMs, splitting the disk image into fixed-size chunks so that only modified chunks need to be uploaded to Proxmox Backup Server on each run (Proxmox Backup Server documentation). Because the bitmap lives in QEMU memory, events that restart the VM process, a full stop/start cycle, a host reboot, or a live migration, clear it, forcing the next backup to re-read the entire disk (though deduplication against previously uploaded chunks still limits the network transfer, even when the read itself is a full scan).
XenServer/XCP-ng
Changed-block tracking support on XenServer/XCP-ng has historically been less standardized across backup tools than on VMware or Hyper-V, with some backup approaches relying on storage-level snapshot deltas rather than a unified vendor API. When sizing storage for XenServer/XCP-ng environments, it's worth explicitly verifying with your backup platform whether true incremental change tracking is active per VM, rather than assuming parity with VMware's CBT behavior.
KVM
KVM-based environments typically rely on QEMU's internal dirty-bitmap mechanism (the same underlying technology Proxmox builds on) combined with qcow2 disk format features for incremental capture. Storage efficiency depends heavily on how the backup tool integrates with libvirt and qemu-img, so incremental efficiency can vary more between KVM backup tools than it does between VMware backup tools, where CBT is a single standardized API.
Red Hat Virtualization (RHV) and Oracle Linux Virtualization Manager (OLVM)
Both RHV and OLVM are built on a KVM foundation and expose incremental backup capability through their respective REST APIs, allowing backup software to request changed disk blocks since a prior checkpoint rather than reading full disk images each cycle. As with KVM generally, verifying that your specific backup integration is using checkpoint-based incremental capture, rather than falling back to full-disk reads, is worth confirming directly rather than assuming.
Decision Matrix: Matching Workload Type to Storage Strategy
Workload profile | Recommended backup type | Recommended retention | Storage priority |
Static infra (DNS, DC, jump boxes) | Forever-incremental, infrequent synthetic full | 14-30 days | Low, minimal storage impact regardless of method |
File/web/app servers | Forever-incremental with weekly synthetic full | 30-60 days | Medium, dedup ratio matters more than schedule choice |
Transactional databases | Forever-incremental + application-consistent snapshots | 30-90 days, longer for compliance | High, prioritize accurate change-rate sampling over dedup tuning |
Regulated/compliance data | Full + incremental with immutable long-term copies (see the CISA 3-2-1 backup guidance) | 1-7 years per regulation | High, plan for Retention Curve Inflection Point savings on long windows. |
Dev/test/ephemeral VMs | Incremental, short chain, minimal fulls | 3-7 days | Low, consider excluding from full-fleet policy entirely |
Field Pattern: When Storage Estimates Fail
A recurring pattern, not a single incident: A common failure mode across environments we've seen described involves a database VM sized using a change-rate sample taken during a normal operational week, say 3% daily change. Storage is provisioned against that number with a modest buffer. Weeks later, a scheduled monthly index rebuild or a large batch data-load event pushes that same VM's daily change rate to 15-20% for one or two days. Because the backup retention window keeps that spike's incremental data for the full retention period (not just briefly), the storage impact compounds every subsequent day until that restore point ages out, turning a one-day event into weeks of elevated consumption. Backup storage utilization crosses 90% capacity with no single obvious cause, because the change-rate sample used for sizing never included a maintenance window in the first place.
The structural fix isn't a bigger buffer, it's sampling change rate across a period long enough to include at least one full maintenance cycle (typically 30 days, not 7), and setting capacity alerts at 80% utilization with enough lead time to act before a spike compounds into an outage.
How to Reduce VM Backup Storage Requirements
Tier retention by workload criticality rather than applying one policy fleet-wide — this is usually the single largest lever available.
Verify change-tracking technology is active and stable (CBT, RCT, dirty bitmaps), so incrementals capture true deltas instead of silently falling back to full reads.
Exclude non-critical, high-churn data from VM-level backups where possible — page files, temp directories, and cache volumes that don't need protection but inflate change rate.
Use forever-incremental with synthetic fulls instead of repeated true fulls, eliminating redundant full-disk reads from production storage.
Compress and deduplicate before encrypting, never after, to avoid losing the pattern redundancy encryption destroys.
Offload older restore points to lower-cost tiers (object storage, tape, or cloud archive) once they age past the window where frequent recovery is likely, keeping fast primary backup storage reserved for recent, high-value restore points.
Platforms like
Vinchin Backup & Recovery apply global deduplication and compression across VMware, Hyper-V, Proxmox, XenServer/XCP-ng, KVM, RHV, and OLVM within a single unified console, which is particularly useful for mixed-hypervisor environments where calculating storage separately per platform (as described above) would otherwise require reconciling several different tools’ reporting formats.
Summary Table: Quick Reference Storage Multipliers
Variable | Typical range | Effect on storage |
Daily change rate | 0.5%-20%+ | Near-linear driver of incremental size |
Retention period | 7-356+ days | Sub-linear growth past the Retention Curve Inflection Point |
Dedup + compression (mixed fleet) | 5:1-15:1 | Primary lever for reducing physical footprint |
Buffer for change-rate spikes | 20%-30% | Absorbs patch cycles, batch jobs, VM sprawl |
Overall SAF (30-day retention, mixed fleet) | 1.6x-2.6x logical | Single planning multiplier per workload class |
FAQs
Q1: Does thin provisioning reduce how much backup storage I need?
Only if the backup software is thin-aware and skips unallocated blocks, otherwise, a thin-provisioned disk that reads as its full provisioned size on backup gets no benefit from thin provisioning on the source side.
Q2: How much spare capacity should I keep on top of my calculated requirement?
20-30% above steady-state is a reasonable default, sized to absorb one retention cycle of unplanned growth without an emergency purchase.
Q3: Can I apply different retention policies to different VMs on the same backup storage?
Yes, most backup platforms support per-job or per-policy retention, and tiering retention by VM criticality is one of the most effective ways to control total storage without weakening protection where it matters.
Q4: Does encrypting backup data change how much storage it consumes?
Encryption overhead itself is negligible, but encrypting before deduplication or compression runs destroys the redundancy those processes rely on, always compress and deduplicate first, then encrypt.
Q5: What happens if backup storage runs out mid-job?
Most platforms fail the job cleanly rather than corrupting the existing chain, but the real risk is a gap in recovery point coverage, which is why 80% capacity alerting matters more than the specific failure behavior.
Q6: Do backup storage requirements scale linearly as I add more VMs?
Not usually, VMs from the same template increase dedup opportunities and lower per-VM cost, but that benefit resets once VMs span separate dedup domains (different jobs, targets, or sites).
Conclusion
VM backup storage sizing is a formula problem, not a lookup-table problem: source data, change rate, retention, backup type, and deduplication interact non-linearly, and treating any one of them as fixed is where estimates fail. Sample change rate across a full maintenance cycle, size retention against its diminishing marginal cost, and validate platform-specific change tracking before trusting any multiplier — including the ones in this article.