For a mixed environment of similar VMs, a realistic mix of Windows and Linux, some templated and some drifted from their base image, a single-pass, cross-VM structural deduplication ratio of 2:1 to 5:1 (50%-80% space reduction) is typical. Once retention and incremental backups are factored in over weeks or months, the combined ratio commonly climbs to 10:1-20:1 or higher. Freshly cloned templates or VDI desktop pools can hit 5:1-10:1 on structural similarity alone, tightly-controlled cloud-scale homogeneous clusters have been measured far higher in academic studies, while database-heavy or encrypted VMs often stay near 1:1. The single biggest lever is not how similar your VMs look, it's your change rate, retention length, dedupe domain scope, and how far your "identical" VMs have already drifted from the template they were cloned from.
Key Takeaways
A conservative, realistic baseline for mixed-VM backup dedupe is 2:1 (≈50% reduction) - treat anything higher as a bonus, not a planning assumption.
Templated or VDI-style environments with high image similarity can reach 5:1-10:1, and up to 17:1 with a hardware dedupe appliance on the target side.
Peer-reviewed research on VM disk images confirms that similarity gains flatten quickly after the first few clones and degrade sharply once different OS versions enter the mix, this isn't just a vendor talking point.
Vendor-quoted ratios of 20:1+ almost always stack structural dedupe, temporal (retention-driven) dedupe, and compression into one number, they don't isolate "how similar are my VMs."
Database VMs and encrypted volumes deduplicate poorly (near 1:1) regardless of how similar the rest of the fleet is.
A higher dedupe ratio isn't free, it costs RAM and CPU for the block index, and past a certain point the marginal capacity saved doesn't justify the marginal hardware cost.
Dedupe domain scope (global repository vs. per-VM chain) and image drift over time often swing the effective ratio more than the raw data itself.
What Dedupe Ratio Actually Measures
Deduplication ratio is the relationship between the logical size of data before reduction and the physical size it occupies after redundant blocks are removed. A 4:1 ratio means 4 TB of logical data fits in 1 TB of physical storage, some vendors instead express this as a 75% capacity savings, which is the identical result stated differently (25% of original size stored = 4:1 ratio). This distinction matters more than it seems: a vendor citing "50% savings" and a competitor citing "2:1 ratio" describe the same outcome, but the percentage framing tends to read as more conservative even when the underlying number is identical.
It's also worth separating deduplication from compression, since most published "reduction ratio" figures are a combined number. Deduplication finds and removes identical blocks; compression re-encodes the remaining unique blocks using an algorithm such as LZ4 or Zstandard to shrink them further. The two multiply rather than add, a 3:1 dedupe ratio combined with a 1.5:1 compression ratio yields a 4.5:1 combined result, as explained in StorageMath's breakdown of combined data reduction ratios.
Ratio
| Equivalent savings
| Ratio
| Equivalent savings
|
2:1 | 50% | 10:1 | 90% |
3:1 | 76% | 15:1 | 93% |
4:1 | 75% | 20:1 | 95% |
5:1 | 80% | 30:1 | 97% |
Typical Dedupe Ratios for Mixed VM Environments
The honest answer is “it depends,” but that’s not useful for capacity planning. The table below separates the scenarios that get conflated in most vendor marketing.
Scenario
| Typical Ratio
| Reduction %
|
Mixed VM fleet, single-pass, default settings, no special tuning | ~2:1 | ~50% |
Templated/cloned VMs, same base image, cross-VM structural dedupe | 5:1–10:1 | 80–90% |
VDI desktop pools (near-identical golden images) | 3:1–10:1 | 70–90%+ |
Backup workload with weeks/months of retention (temporal + structural) | 10:1–20:1+ | 90–95%+ |
Hardware dedupe appliance, target-side (e.g., Data Domain-class) | up to 17:1 | ~94% |
ZFS-backed VM boot volumes (common on Proxmox) | 3:1–5:1 | 66–80% |
Homogeneous cloud-node clusters (e.g., Hadoop-style, many near-identical nodes, controlled lab study) | up to 70x–220x* | 98%+* |
Database VMs / in-guest encrypted volumes | ~1:1–1.3:1 | 0–25% |
*The 70x–220x figure comes from a controlled lab study of many near-identical compute nodes deployed from one image for a big-data cluster, where a large share of each disk was empty, zero-filled blocks, it is not representative of a typical mixed production environment and is included here only to show the theoretical ceiling under ideal homogeneity.
Academic Evidence: What Controlled Studies Actually Found
Most of the numbers circulating online come from vendor blogs and forum anecdotes. It’s worth grounding this in the closest thing the field has to controlled research: Jin and Miller’s peer-reviewed study, “The Effectiveness of Deduplication on Virtual Machine Disk Images” (SYSTOR 2009), which ran extensive deduplication experiments across real sets of VM disk images. Three findings from that study are directly relevant to sizing a mixed environment today:
Similarity gains flatten fast. The study found that the amount of additional stored data grows very slowly after the first few virtual disk images, as long as only the locale or software configuration changes between them, meaning the biggest dedupe win comes from the first handful of clones sharing a base image, with diminishing returns after that.
OS version diversity is a bigger enemy of dedupe than most admins assume. The compression rate suffered noticeably once different versions of an operating system, or entirely different operating systems, were mixed into the same set, which directly supports treating “OS/template homogeneity” as a first-order factor in any ratio estimate, not a minor one.
Chunking strategy matters less than expected, and zero-block detection matters more. The researchers found that simple fixed-length chunking achieved nearly the same reduction as more complex variable-length chunking, while just identifying zero-filled blocks, even in ready-to-use disk images, produced significant saving on its own. This is a useful sanity check against marketing claims that a proprietary chunking algorithm alone explains a large ratio advantage.
When read together with the vendor and community figures earlier, the academic evidence supports the same conclusion from a different angle: cross-VM structural similarity is real and valuable, but it saturates quickly and is fragile to exactly the kind of OS and configuration drift that happens naturally in any environment older than a few weeks.
The Three-Layer Dedupe Stack
The following framework is our own synthesis, built to reconcile the conflicting ratio figures published across the industry.
Every published “dedupe ratio” is actually the product of three independent, multiplicative layers, and most articles quote a single number without telling you which layers are included:
1. Structural layer (cross-VM, single point-in-time): how much of VM B’s data already exists somewhere in VM A, C, D... because they share an OS, application stack, or base image. For a realistically patched, semi-diverged mixed fleet, this layer alone typically contributes 1.5:1 to 3:1.
2. Temporal layer (cross-restore-point, same VM over time): how much of today’s backup already exists in yesterday’s, last week’s, or last month’s backup of the same VM. This is driven by daily change rate and retention depth, and it typically contributes far more than the structural layer, often 3:1 to 15:1 depending on retention policy.
3. Compression layer: a final, independent multiplier of roughly 1.3:1 to 2:1 applied to whatever unique data survives the first two layers.
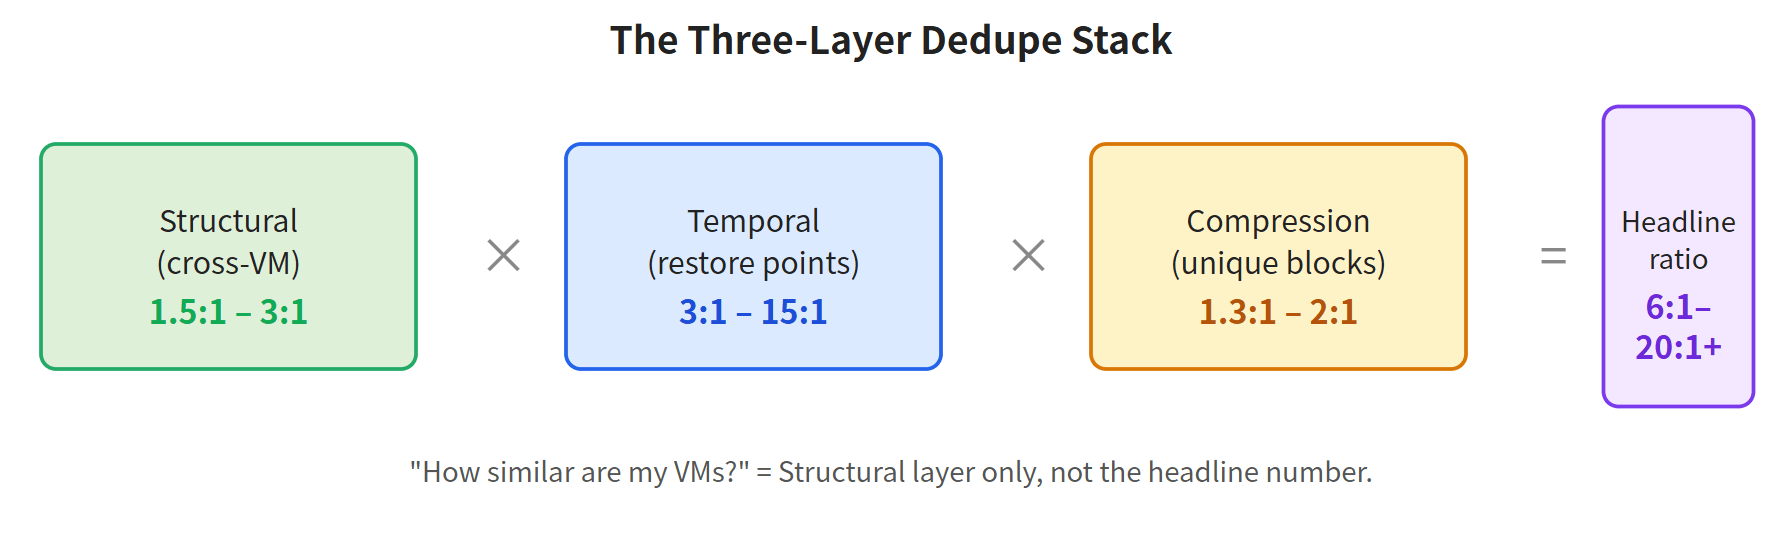
Multiply the three layers, and you get the headline numbers vendors advertise: a 2.5:1 structural layer x 6:1 temporal layer x 1.5:1 compression easily produces the "20:1+" figures seen in marketing material. But an engineer asking "how similar are my VMs, really?", which is what most people mean when they ask about dedupe ratio for a mixed environment, is only asking about layer one. That's why the honest, apples-to-apples answer to this article's title is closer to 2:1-5:1, not 20:1: the higher numbers are real, but they answer a different question than the one being asked. This also explains why two engineers can each be technically correct while disagreeing sharply in the same forum thread: one is quoting the structural layer, the other the fully stacked number.
The Golden Image Drift Curve
This is a conceptual model we use internally to explain a pattern that shows up repeatedly in customer environments, treat it as a directional planning tool, not a measured statistic.
Most dedupe ratio estimates implicitly assume a static snapshot of similarity, but VM similarity is not static, it decays. On the day ten VMs are cloned from one template, their structural dedupe ratio is near its theoretical maximum because the disk blocks are nearly identical copies. From that moment forward, every OS patch, every unique application installed, every accumulated log file, and every user-generated file pulls each clone further from its siblings and from the original template.
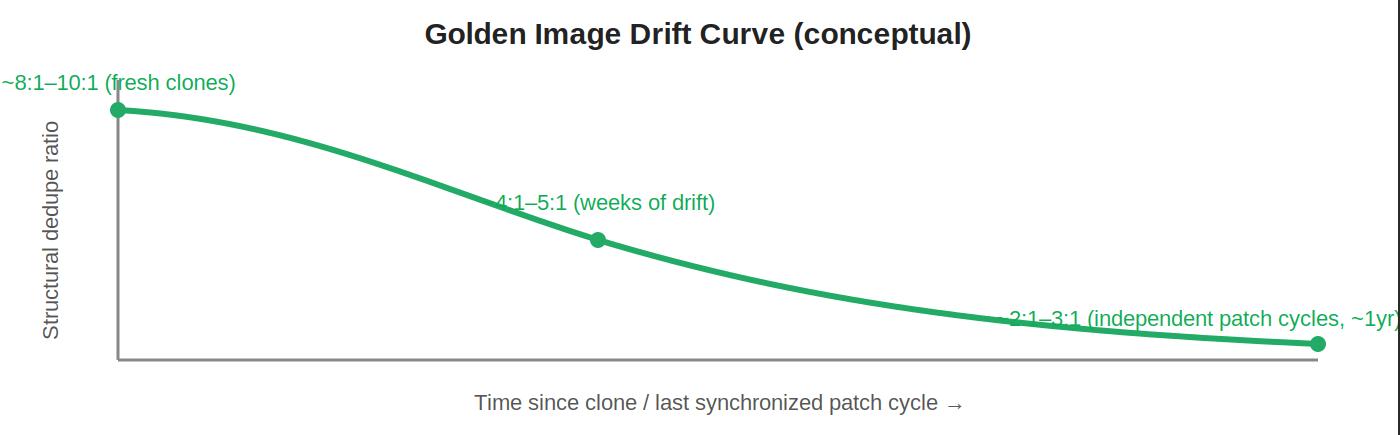
The practical effect is that the same fleet, sized once at deployment time, will systematically underdeliver on its dedupe ratio a year later, not because the storage system got worse, but because the data stopped being as similar as it was on the day it was measured. If you’re sizing a backup repository based on a dedupe ratio measured against freshly cloned VMs, discount that number for long-term planning. A fleet that shows 8:1 structural similarity in month one is a reasonable candidate to be closer to 3:1-4:1 within a year of independent patch cycles, security updates, and organic growth, simply from image drift, before retention and compression are even applied. Environments that patch all VMs from the same golden-image pipeline on a synchronized schedule resist this decay far better than environments where each admin patches VMs individually and on different cadences.
The Dedupe Ratio Break-Even Point
Chasing a higher dedupe ratio is not free. Every additional match the engine has to find requires a larger in-memory or on-disk index of block fingerprints, and general guidance for backup dedupe sizing puts this at roughly 1-5GB of RAM per TB of deduplucated data, with common sizing outcomes around 2.5 GB/TB at typical block sizes, so a 10 TB deduplicated pool can require on the order of 25 GB of RAM just for the index, independent of what the OS and applications need. Push toward smaller chunk sizes or wider (global) matching domains to squeeze out a marginally better ratio, and that RAM/CPU requirement grows faster than the capacity you’re saving, especially once you’re already past the structural layer’s natural ceiling described above.
The practical break-even question is simple to frame even without precise benchmarking: does the storage cost avoided by the next increment of ratio improvement exceed the extra RAM, CPU, and licensing cost required to achieve it? For most mixed environments already sitting in the 2:1-5:1 structural range, the answer flips to "no" well before reaching appliance-assisted ratios like 17:1, which is exactly why that level of ratio is typically reserved for large-scale, dedicated backup targets rather than general-purpose primary storage. Sizing decisions should target "good enough for the retention policy," not the theoretical maximum.
What Actually Drives Dedupe Ratio in a Mixed Environment
Change rate: the percentage of data that changes between backups. A daily change rate of 1% retained for 30 days can approach a 30:1 ratio purely from redundancy across restore points, while a weekly full retained for a month lands closer to 4:1, per the worked example in TechTarget's analysis.
Retention depth: more restore points retained means more opportunity for the temporal layer to find redundancy, usually the largest single lever available to an administrator.
Data type mix: text-based data, logs, and OS system files dedupe well; already-compressed formats, encrypted volumes, and high-entropy database files dedupe poorly regardless of fleet similarity.
OS and template homogeneity: confirmed by academic research above as a first-order factor, a fleet standardized on two or three templates structurally dedupes far better than one built VM independently by VM.
Block size and chunking method: smaller, variable-length blocks catch more matches than large fixed blocks, at the cost of a larger in-memory index; research suggests the real-world gap between fixed and variable chunking is smaller than commonly assumed.
Dedupe domain scope: covered in detail below, often underrated relative to the attention it gets.
Image age/drift: per the Golden Image Drift framework above, a factor almost absent from vendor sizing guides.
RAM, CPU, and Index Overhead: The Hidden Cost of a High Ratio
Deduplication doesn’t happen for free at the moment of backup. Every unique block written needs a fingerprint (typically a hash) computed and checked against an index of every other block already stored, and that index has to live somewhere fast, usually RAM, sometimes a fast SSD tier. Two architectural choices determine when this cost is paid:
Inline deduplication hashes and matches blocks during the backup job itself, before they’re written to disk. This avoids ever writing duplicate data, but adds CPU load to the backup window and can slow it down on constrained hosts.
Post-process deduplication writes data first and deduplicates afterward in a background job. This keeps the backup window fast but temporarily requires the full undeduplicated capacity on disk until the optimization pass completes.
Neither option eliminates the cost - inline move it to backup-window CPU, post-process moves it to temporary capacity and a later I/O spike. Sizing a mixed environment around a specific ratio target should always include the index/RAM overhead as a line item, not just the storage saved, since undersizing RAM for the dedup index is a common cause of dedupe engines silently falling back to a lower ratio under memory pressure.
Source-Side vs. Target-Side Deduplication
Where deduplication happens changes what it optimizes for:
Source-side deduplication runs on or near the VM/host before data is transferred, which reduces network load during the backup job, valuable for remote sites or bandwidth-constrained links, but requires CPU cycles on infrastructure that's also running production workloads, this can slow VM performance if not carefully scoped.
Target-side deduplication runs on the backup repository or appliance after the full data set has already been transferred, so it doesn’t reduce network load but keeps CPU overhead off production hosts. This is the model behind hardware dedupe appliances capable of the higher ratios (up to 17:1) cited earlier.
For a mixed environment specifically, source-side dedupe has an added benefit worth calling out: because it operates on data before it leaves the host, it’s naturally positioned to catch structural similarity across VMs on the same host or cluster, which is often where template-driven similarity is highest. Vinchin Backup & Recovery, for instance, supports both compression and deduplication on its backup repository, which is one reason a mixed fleet backed up this way tends to land nearer the upper end of the 2:1-5:1 structural range rather than the lower end.
Platform-Specific Notes
VMware vSphere: Changed Block Tracking (CBT) reduces what gets read for incremental, complementary to but distinct from dedupe. A low rate improves CBT efficiency and gives the temporal layer more to work with, but doesn’t by itself improve cross-VM structural similarity.
Microsoft Hyper-V: Windows Server’s native Data Deduplication feature, applied to a Cluster Shares Volume hosting many similar VHDX files, is documented as reaching some of the highest ratios in this article for VDI-style deployments, per Microsoft’s own DPM deduplication guidance.
Proxmox VE: environments using ZFS-backed storage for VM disks commonly see block-level dedupe in the 3:1–5:1 range for VM boot volumes, though ZFS dedupe's RAM overhead needs to be planned for separately from backup-target dedupe, this is one of the clearest real-world illustrations of the RAM/ratio trade-off described above.
Citrix XenServer: similar to VDI patterns above when desktop or app-server pools share a base image; ratio drops sharply for XenServer hosts running heterogeneous, independently built server workloads.
KVM: ratio is almost entirely a function of the backup target's dedupe engine rather than KVM itself, since KVM has no native storage-level dedupe comparable to Hyper-V's; qcow2 disk format and thin-provisioning choices affect how cleanly blocks align for matching.
Oracle OLVM / Red Hat RHV (KVM-based): both inherit the same KVM-level consideration, dedupe effectiveness depends heavily on whether the backup repository performs global or per-job matching, since the hypervisor layer itself doesn't natively deduplicate storage.
Decision Matrix: Estimating Your Own Expected Ratio
Use this as a directional scoring tool rather than a precise calculator, assign your environment a rough position on each axis, and let the combination guide which row of the ratio table above is realistic for you.
Factor
| Pulls ratio toward the low end (2:1-3:1)
| Pulls ratio toward the high end (5:1-10:1+)
|
Template homogeneity | Every VM built independently | Most VMs cloned from 1-2 golden images |
Image age/drift | Fleet patched independently over 1+ years | Recently cloned or synchronized golden-image pipeline |
Patch cadence | Ad hoc, per-VM patching | Synchronized patching across the fleet |
Data type mix | Heavy database or media workloads | Mostly OS, application, and log data |
Encryption | In-guest disk encryption enabled | Encryption applied only at the repository, not the source |
Retention policy | Short retention, few restore points | Long retention with daily incrementals |
Dedupe domain | Per-VM backup chains | Global, repository-wide deduplication |
RAM/index budget | Memory-constrained backup target | Adequately sized RAM for the dedup index |
Common Mistakes When Sizing Storage Around Dedup Ratios
Sizing on a vendor’s best-case number. A 20:1+ figure usually already includes retention and compression, apply it to raw structural similarity, and you will under-purchase capacity.
Measuring ratio once, at deployment, and never revisiting it. As the Golden Image Drift framework shows, a ratio measured on day one is not a stable long-term planning number.
Ignoring dedupe domain scope when comparing quotes. Two products tested against the same VM set can report different ratios purely because one dedupes per job and the other dedupes globally.
Assuming database and file-server VMs will dedupe the same. A fleet that's 30% database VMs should be sized with a blended, not uniform, expected ratio.
Encrypting at the wrong layer. In-guest encryption silently kills dedupe potential for that VM's data; encrypting at the backup repository instead preserves the source data's dedupability.
Ignoring the RAM/index cost of chasing a marginally higher ratio. Past the structural layer's natural ceiling, the extra hardware cost frequently exceeds the storage saved.
FAQs
Q1: Does a higher dedupe ratio mean faster restores?
Not necessarily, dedupe ratio measures capacity saved, not restore speed. Heavily deduplicated data is often more scattered across physical disks, which can slow sequential-heavy restores unless the target storage uses SSD or NVMe. Some backup tools intentionally trade a lower ratio for more contiguous, faster-restoring data.
Q2: Is dedupe ratio the same as compression ratio?
No, they're independent, multiplicative processes. Deduplication removes redundant blocks that already exist elsewhere; compression re-encodes the remaining unique data. A single "reduction ratio" figure from a vendor is frequently both combined into one number.
Q3: Can I improve my ratio without new hardware?
Yes. Moving from per-VM to a shared, global repository, aligning schedules so similar VMs run in the same job, standardizing on fewer OS templates, and keeping encryption at the repository layer rather than in-guest are all no-cost, software-level changes.
Q4: Does in-guest disk encryption break deduplication?
Effectively yes, encryption randomizes data so identical source content produces unrelated ciphertext, which the dedupe engine can no longer match. Encrypting at the backup repository rather than inside the guest OS preserves dedupability of the underlying data.
Q5: How does Changed Block Tracking (CBT) relate to dedupe ratio?
They solve different problems. CBT reduces how much data is read and transferred for an incremental job by tracking which blocks changed; dedupe then decides whether those changed blocks are actually unique. A low-change-rate VM benefits CBT most; a high-similarity fleet benefits dedupe most, a fleet can score well on one and poorly on the other.
Q6: Why do vendors advertise ratios like 30:1 that nobody seems to hit in practice?
Those figures are usually genuine best-case results from long-retention, low-change-rate, highly templated environments, or they silently combine dedupe with compression. Treat vendor maximums as a planning ceiling, not a default expectation.
Q7: Does deduplication increase backup or restore time?
Inline dedupe adds CPU overhead during the backup itself, since every block must be hashed and compared before writing, this can extend backup windows on CPU-constrained hosts. Post-process dedupe avoids this during backup but needs temporary extra capacity and a later optimization pass, shifting rather than removing the cost.
Conclusion
Plan a mixed VM fleet around 2:1–5:1 for structural similarity, 10:1–20:1+ once retention and compression stack on top, and remember the ratio you measure today will erode as clones drift from their template. Dedupe ratio is less a property of your VMs and more a property of your retention policy, dedupe domain scope, and how disciplined your patch cadence stays over time.