-
What is an IO Delay in Proxmox?
-
What is an Acceptable IO Delay?
-
How to Find out Reason for Proxmox IO Delay?
-
Reliable Proxmox VM Backup Solution
-
Proxmox IO Delay FAQs
-
Conclusion
Storage matters for VM performance. IO delay reveals storage wait times. It can slow VMs and frustrate admins. This article explains IO delay in Proxmox VE. You will learn what it means, what levels are acceptable, and how to trace causes at beginner, intermediate, and advanced levels.
What is an IO Delay in Proxmox?
IO delay shows how much time processes wait on disk operations. Proxmox VE reports IO delay under the node's Summary view to help admins spot storage bottlenecks. It stems from the Linux block layer's iowait metric, tracking CPU idle time with pending I/O . In practice, IO delay aggregates wait times for all processes on the host, sampling kernel stats periodically .
Proxmox's IO delay differs from raw CPU load. High CPU use may reflect compute work, but high IO delay signals storage cannot keep up. The metric helps isolate disk-related slowdowns. It correlates with Linux's %iowait shown by tools like iostat . When IO delay rises, processes block waiting for reads or writes to finish, delaying VM tasks and operations like snapshots or backups.
Proxmox samples IO delay by checking the count of tasks in uninterruptible sleep (D state) waiting for disk I/O. It expresses the aggregated wait time as a percentage of total CPU time. This sampling provides a node-level view separate from per-VM metrics. Admins can monitor it in real time via the web UI or fetch metrics via APIs for external dashboards .
IO delay reacts quickly to storage load. For example, cloning a VM triggers high disk reads, spiking IO delay until the copy completes. Likewise, heavy writes from inside a VM can raise it. Observing IO delay trends helps correlate slow VM response with underlying storage pressure. In summary, IO delay is Proxmox's view of storage wait, based on Linux iowait, guiding admins to storage issues early.
What is an Acceptable IO Delay?
Acceptable IO delay ensures VM responsiveness stays within service levels. Under light or moderate load, values under 5% often pose no visible impact. Spikes to 10–15% can occur during tasks like backups or live migrations without harm if they are brief . However, sustained values above 20% typically signal storage stress needing action .
Workload type affects thresholds. In a home lab, brief higher delay may be tolerable. In production, even short spikes can upset latency-sensitive services. Ask: is the workload latency-critical? If yes, aim for under 5% most times and avoid long spikes. If batch tasks run off hours, allow higher delay then. Trends matter: track IO delay over days or weeks to spot rising baseline.
Observe patterns: occasional spikes during backups can be normal if scheduled. But if IO delay stays elevated when idle, investigate storage health or configuration. Many admins treat persistent above 10% as warning and above 20% as critical. Some find 30% acceptable briefly under heavy workload, but avoid letting it linger. Very high spikes (50%+) often cause unresponsive VMs and should trigger immediate mitigation .
Different storage affects tolerance: SSD arrays handle more IOPS, showing lower delay under load. HDDs or mixed pools may hit higher delay sooner. Network storage like NFS or iSCSI can add latency. For Ceph or other distributed storage, network load also influences IO delay. Understand your storage capabilities and align delay thresholds accordingly.
Proxmox version and config can matter. Newer kernels and drivers often improve performance and reduce IO wait. Updated Proxmox VE releases may include scheduler tuning or better multi-queue support. Always test threshold settings after upgrades. In sum, acceptable IO delay depends on workload, storage, and admin’s risk tolerance, but under 5% typical; sustained above 20% needs review.
How to Find out Reason for Proxmox IO Delay?
Finding causes involves layered checks from hardware to guest. Begin with simple health checks then advance to deep analysis.
1. Check Basic Hardware Health
First, check drive health and basic metrics. Use smartctl -H on disks to verify they report healthy status. Overheating SSDs may throttle, raising IO delay unexpectedly . Check drive temperatures via SMART attributes and server sensors. Next, inspect RAID controller health or ZFS pool via zpool status. Faulty disks or degraded arrays can cause delays.
Test simple I/O: run dd if=/dev/zero of=/path/to/storage/testfile bs=1M count=1024 oflag=direct inside a test VM or on host. Observe throughput consistency. Unexpectedly low speeds hint hardware or config issues. At this level, also verify cabling and power: loose cables or failing PSU can affect storage performance.
2. Monitor OS-Level Activity
Next, monitor I/O activity on the host OS. Run iostat -x 1 to see device utilization, await times, and queue lengths. Look for %util near 100% or high await values, indicating saturation . Use iotop to identify processes with heavy I/O. Filter to root: sudo iotop -ao. Spot QEMU or backup processes hitting disks. Correlate I/O peaks with IO delay spikes in Proxmox UI logs.
Check CPU states: use mpstat 1 or vmstat 1 to view %iowait. High iowait aligns with IO delay. But note iowait may hide per-device issues; always check per-disk stats. Use lsblk or df -h to confirm which disks back which VMs.
If using network storage, test network health: ping to NAS or storage target; iperf3 between hosts to measure bandwidth. High latency or low throughput can raise IO delay. For NFS/iSCSI, check mount options: improper settings (noasync vs async) can affect performance.
3. Inspect Storage Stack
Explore storage layer specifics. For ZFS, use zpool iostat -v 1 to see pool-level I/O, per-vdev stats, read/write distribution. If ARC is small, reads may hit disks often, raising delay . Consider ARC tuning: raise cache if memory allows, but keep headroom for VMs.
For LVM, check thin vs thick provisioning: thin pools can fragment and cause slow metadata operations. Use lvs -a -o+seg_monitor to inspect thin pool health. For LVM on network storage, ensure volume alignment matches underlying storage blocks to avoid extra overhead.
For Ceph, monitor OSD performance via Ceph dashboard. High OSD latency directly impacts Proxmox IO delay. Check network throughput on public and cluster networks. Ensure no saturated links.
Check filesystem choices: XFS, ext4, or ZFS have different behavior under load. Metadata-heavy workloads may slow on filesystems lacking tuned journaling settings. Review mount options; for ext4, consider disabling barriers only if safe.
4. Review Proxmox Configuration
Run pveperf on nodes to measure fsync/sync and disk I/O baseline . Low fsync/sec suggests slow metadata operations. Compare results across nodes. Ensure consistent hardware and settings.
In Proxmox GUI, watch which VM triggers IO delay. Use Task History: check timestamps when delay spiked. Match with VM operations: backups, snapshots, live migrations. Consider scheduling heavy tasks off-peak.
Verify VM disk settings: prefer VirtIO SCSI or VirtIO Block with caching set to writeback or none based on workload. Avoid unsafe caches in production. In guest OS, install and update VirtIO drivers for best performance. For Windows VMs, use latest VirtIO ISO. For Linux guests, ensure virtio-blk or virtio-scsi modules loaded.
Review Proxmox storage configuration: for directory-based storage, ensure host filesystem performance is adequate. For LVM-thin, check thin pool fragmentation. For ZFS, check recordsize: choose recordsize matching VM workload (e.g., 16K for databases, 128K for general use). For Ceph, adjust rbd features and caching.
5. Examine Logs
Check dmesg for storage driver errors: timeouts, resets. Frequent errors impair performance. Check /var/log/syslog and /var/log/kern.log for repeated I/O errors or warnings. In VM logs under /var/log/pve/tasks, look for errors in backup or migration tasks.
If suspecting hardware, check RAID logs or vendor tools (e.g., MegaCLI, storcli) for array warnings. For SMART, examine extended attributes: smartctl -a /dev/sdX for reallocated sectors or pending sectors.
6. Tuning and Testing
Tune Linux I/O scheduler: for rotational disks, consider deadline scheduler; for SSDs, use none or mq-deadline under multi-queue. Change via: echo mq-deadline > /sys/block/sdX/queue/scheduler . Test changes under controlled load; monitor IO delay before and after.
Adjust ZFS tunables: ARC size, ZIL/SLOG placement. For write-heavy workloads, place SLOG device on low-latency SSD. Ensure ZFS recordsize matches guest workload. For heavy random writes, smaller recordsize may help. Monitor ZFS latency via zpool iostat.
For LVM-thin, regularly run thin_repair or convert hot data to thick volumes if thin fragmentation is high. On heavy workloads, consider pre-allocating extents.
Network stack tuning: for NFS or iSCSI, adjust MTU (jumbo frames) if network supports. Tune TCP window sizes for high-latency links. For iSCSI, enable multiple sessions or multipath for redundancy and throughput.
Use advanced benchmarking: run fio inside a test VM or on host to simulate workloads. For example, fio --name=randread --ioengine=libaio --rw=randread --bs=4k --numjobs=4 --size=1G --runtime=60 --group_reporting. Compare latency and IOPS to expected capacities .
Investigate kernel-level metrics: use perf or blktrace for deep tracing of block layer. This helps pinpoint queuing delays or scheduler contention. Use iostat -xk 1 and vmstat 1 during tests to correlate.
For extreme scale, consider offloading storage: use NVMe-oF or dedicated SAN arrays. For hyper-converged setups, ensure cluster network dedicated to storage traffic with QoS.
7. Capacity Planning
Monitor storage growth and IOPS demands over weeks. Use historical data to forecast when storage will saturate. Tools like Prometheus with Proxmox exporter can track IO delay trends over time. Plan addition of disks or migration to faster media before issues arise.
For distributed storage like Ceph, plan OSD count and network bandwidth to handle peak workloads. Use simulation tools or proofs-of-concept to test architecture.
Consider tiered storage: place hot VM disks on SSD pool, cold ones on HDD. Move VMs dynamically based on usage patterns. Use Proxmox Storage Migration to shift disks.
Reliable Proxmox VM Backup Solution
Before you tweak storage settings, secure your data with a reliable backup. Vinchin Backup & Recovery is a professional, enterprise-level VM backup solution supporting Proxmox alongside VMware, Hyper-V, oVirt, OLVM, RHV, XCP-ng, XenServer, OpenStack, ZStack, and over 15 environments. It offers features like forever-incremental backup, data deduplication and compression, V2V migration, throttling policy, and more, while providing many additional protections under the hood.
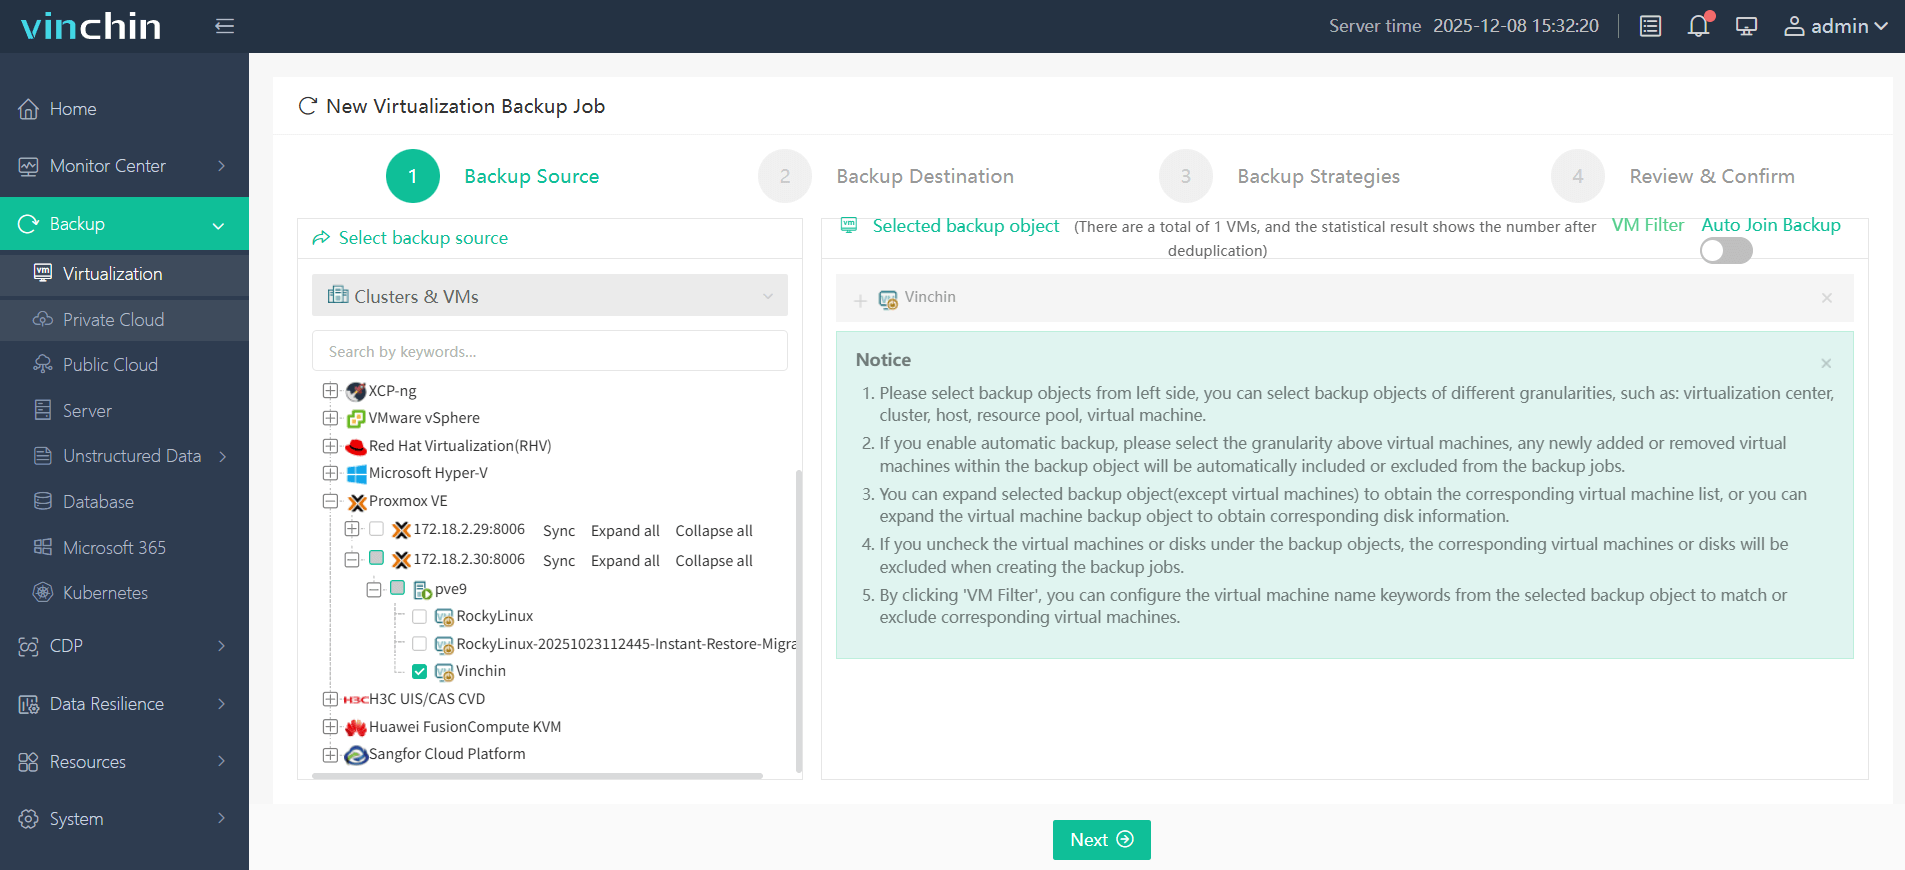
Its web console is intuitive. You can:
Select the Proxmox VM to back up;
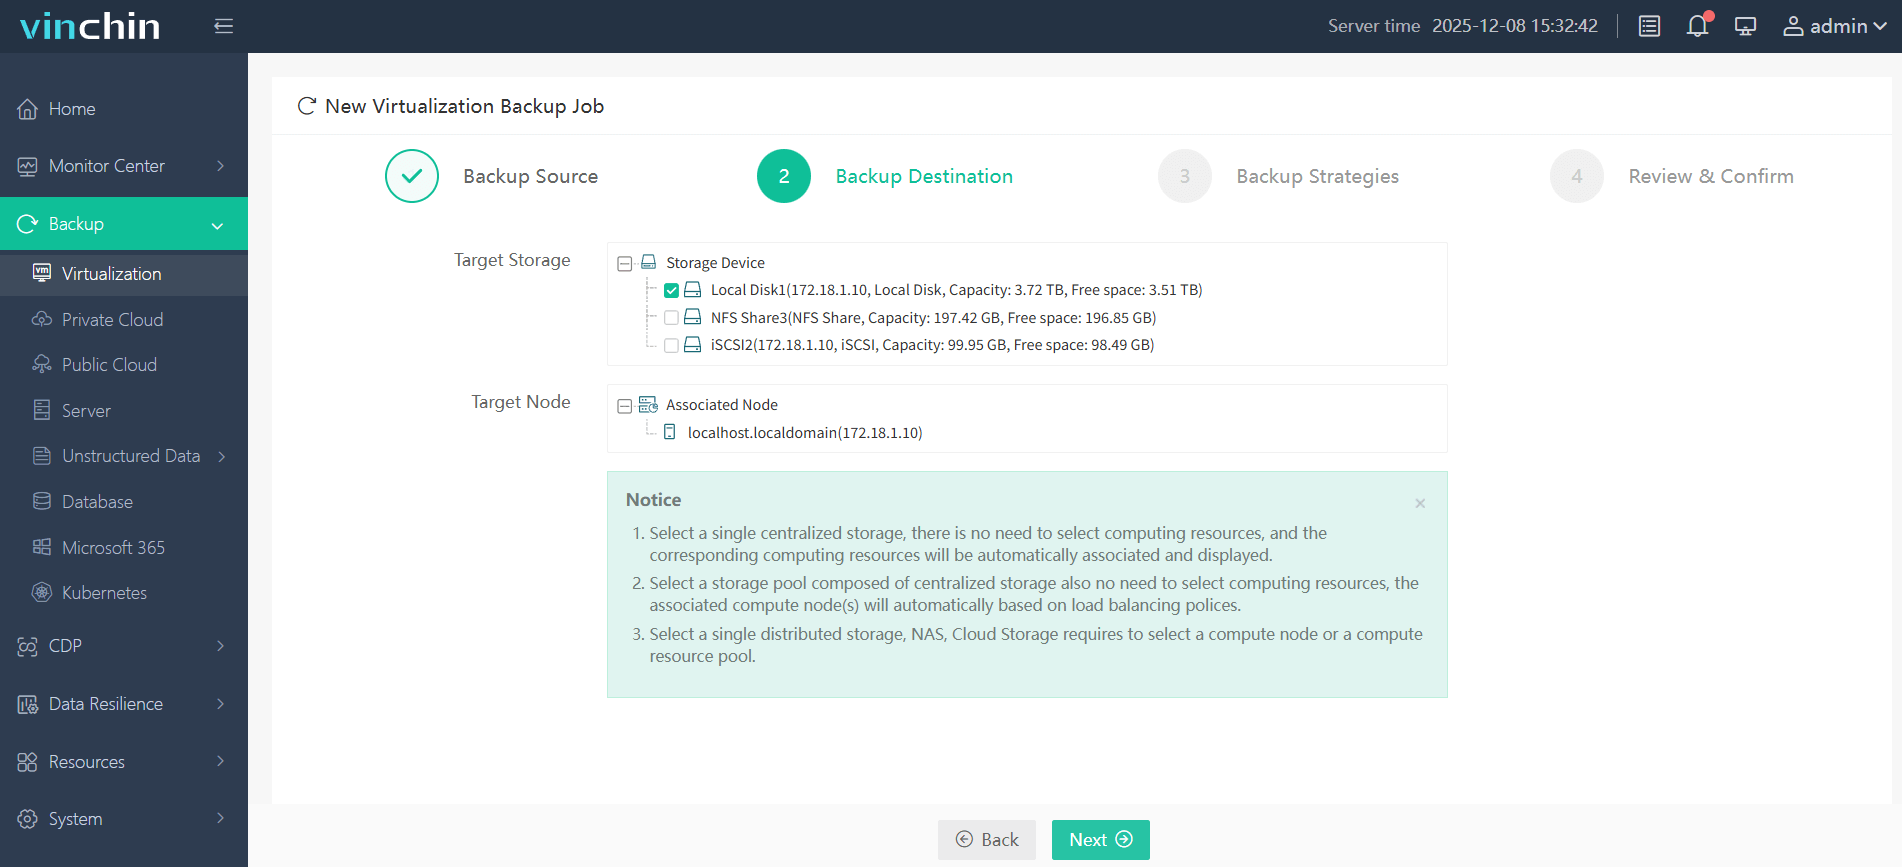
Then choose backup storage;
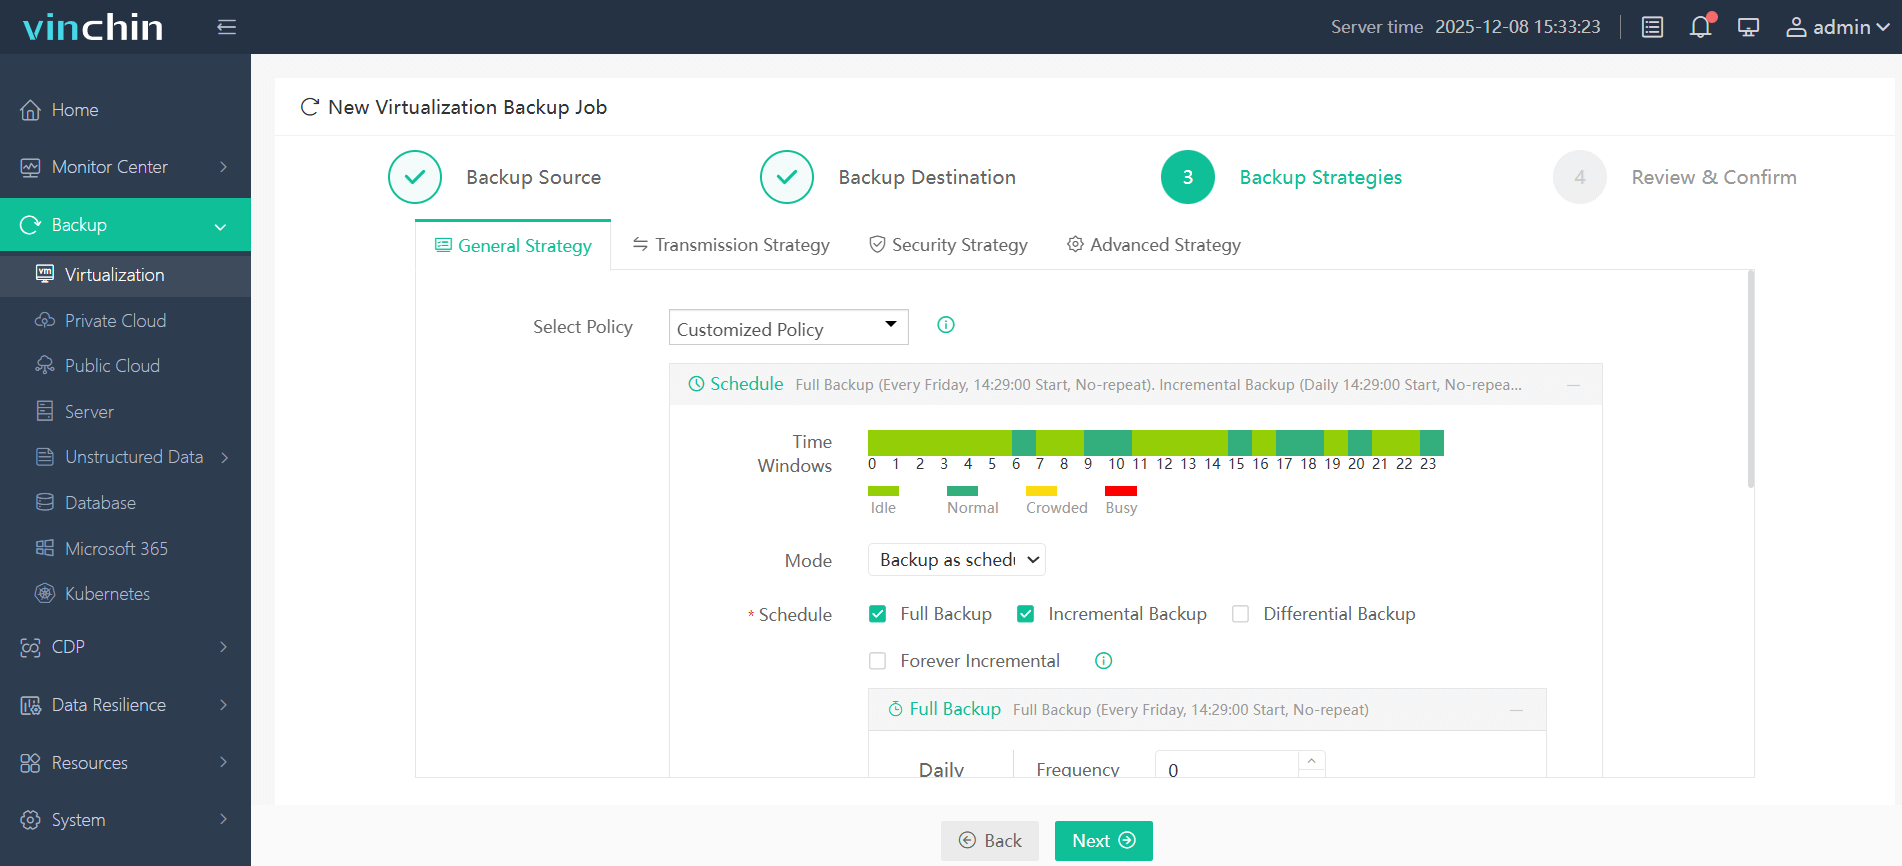
Next configure the backup strategies;
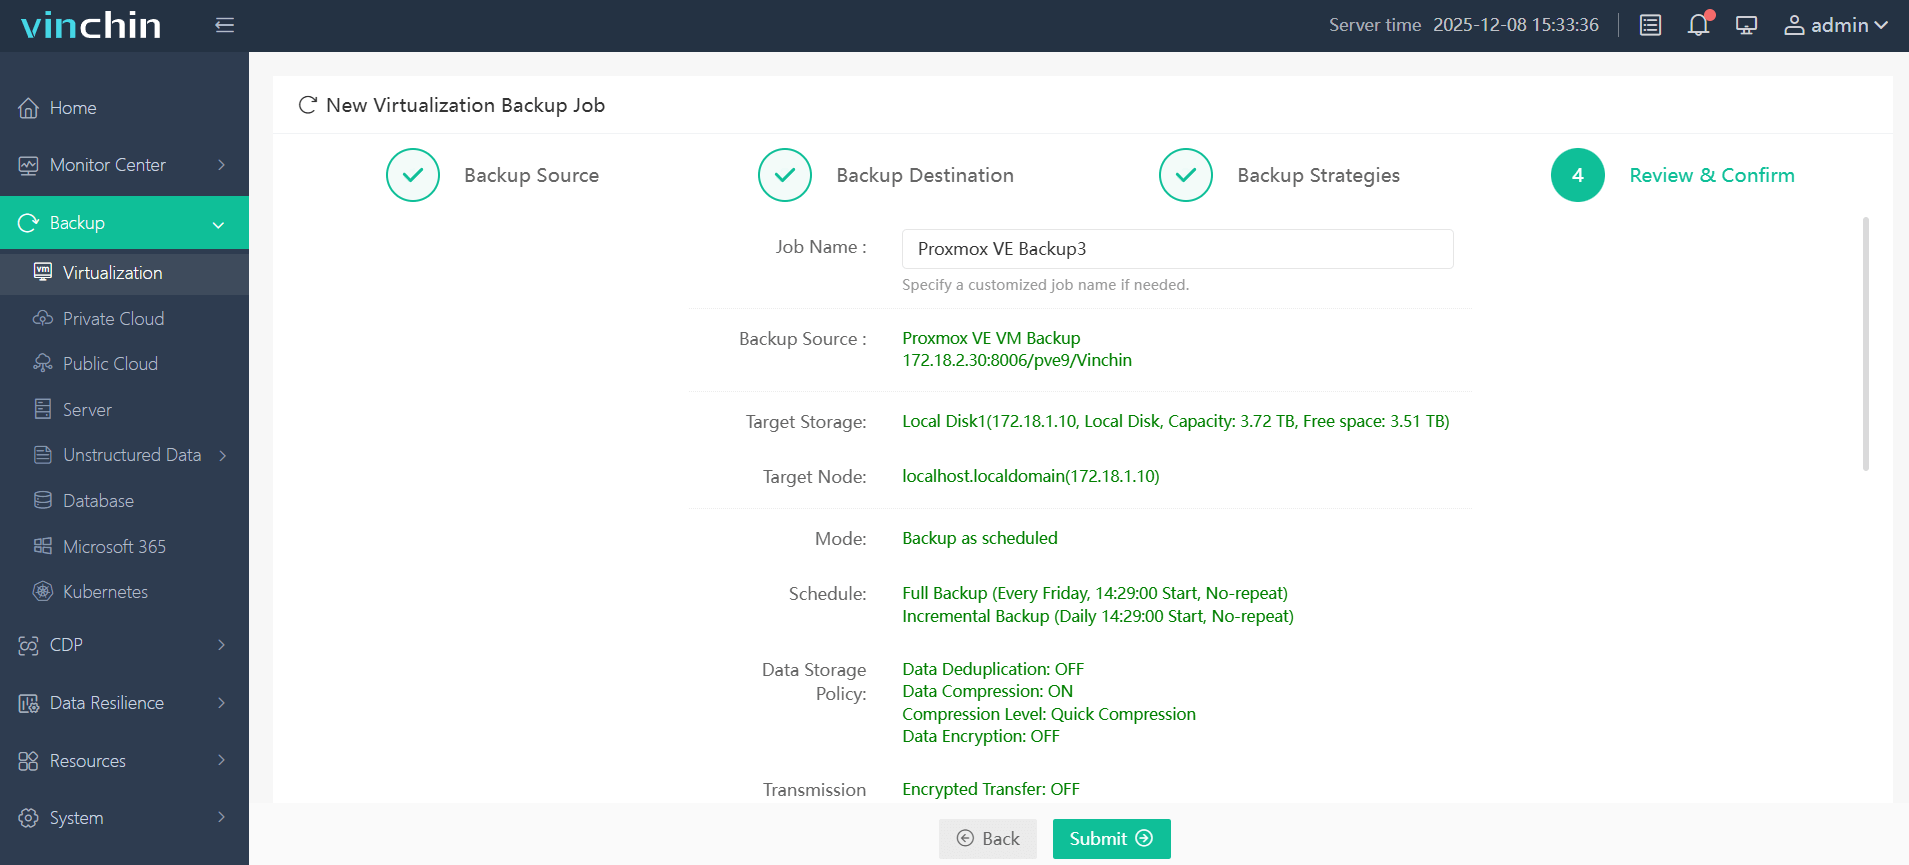
Finally submit the job to start backup.
Vinchin is trusted by customers worldwide with top ratings. Try a 60-day full-featured free trial and protect Proxmox VMs with ease. Click Download Installer to start.
Proxmox IO Delay FAQs
Q1: What level of IO delay is safe for daily Proxmox workloads?
A1: Under 5% is normal; occasional spikes to 10–15% are fine; sustained over 20% needs review.
Q2: How can I check which VM causes high IO delay?
A2: Use iotop to spot heavy disk I/O, then shut down or pause the VM to confirm impact.
Q3: Can backup tasks trigger IO delay, and how to minimize it?
A3: Yes; use incremental or forever incremental backups and schedule off-peak windows to reduce load.
Conclusion
IO delay reveals storage wait times that can slow VMs. You learned what IO delay is, why values under 5% are ideal, and when spikes matter. You saw how to check hardware health, monitor I/O with tools like iostat and iotop, inspect storage stacks from ZFS to network storage, and tune settings at the OS and Proxmox levels. Advanced steps include deep tracing with fio, capacity planning, and scheduler tuning.
Always back up VMs before major changes—Vinchin’s solution offers forever-incremental backup, deduplication, and more to protect data safely. Try Vinchin’s 60-day free trial to secure your Proxmox environment.
Share on:


